113
submitted 1 month ago by [email protected] to c/[email protected]

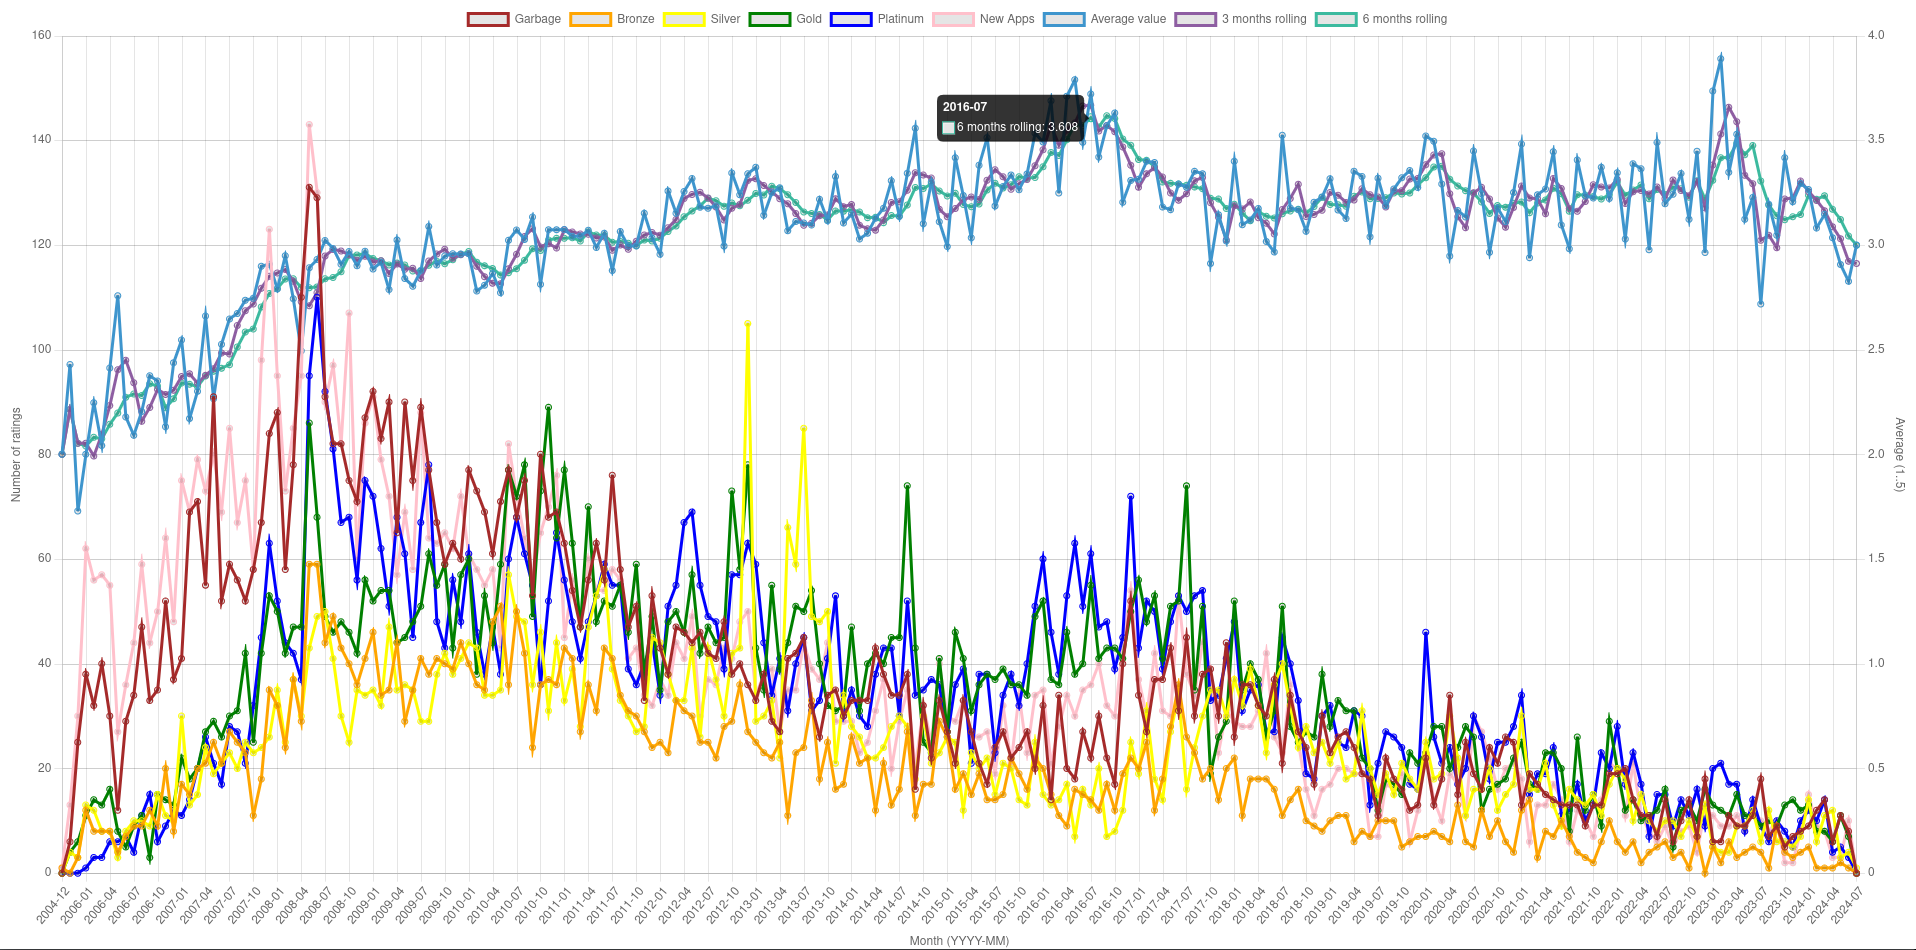
I took each rating for games on Wine Application Database, mapped them to numbers (Garbage -> 1, Bronze -> 2, Silver -> 3, Gold -> 4, Platinum -> 5) and plotted a monthly average.

top 33 comments
sorted by: hot top controversial new old
[-] [email protected] 28 points 1 month ago

The left axis is average number of ratings per app. As all rating except the 3 month, 6 month etc lines have dropped then to me this suggests there has been an explosion in the number of apps in the database.

The more apps, means more smaller apps with frwer user ratings so the lower the average number of ratings per app overall would be?

[-] [email protected] 3 points 1 month ago

The left axis is total number of ratings of each type (Garbage, Bronze, Silver, Gold, Platinum) in a given month (not per app). For example for month 2016-07 there were

  "Garbage" => 22
  "Bronze" => 14
  "Silver" => 13
  "Gold" => 55
  "Platinum" => 61

On right side is the average rating. So if I assign values to each rating:

  "Garbage" => 1
  "Bronze" => 2
  "Silver" => 3
  "Gold" => 4
  "Platinum" => 5

I can get an average rating, which will be between 1 to 5.

((22*1) + (14*2) + (13*3) + (55*4) + (61*5)) / (22 + 14 + 13 + 55 + 61)
 ~=  3.721
[-] [email protected] 22 points 1 month ago
[-] [email protected] 8 points 1 month ago

I don't get "Number of ratings" on the y scale. I tjought it's an average number?

[-] [email protected] 6 points 1 month ago* (last edited 1 month ago)

GPU passthrough for virtual machines became way more accessible around 2016. From my personal experiences, I got more into figuring out Wine and Linux stuff in general once I knew I could pass a GPU to my virtual machines.

[-] [email protected] 4 points 1 month ago* (last edited 1 month ago)

~~DXVK~~. ~~2016~~ was when I moved to Linux as my primary operating system because with DXVK, most of my games ran overnight.

Edit: Oops I missed the mark, DXVK occurred in 2018, I was off by two years. My bad.

[-] [email protected] 2 points 1 month ago

is this the ratings on winehq? I could see the count of apps exploding on that page but ordinary users aren't going to visit there to know they can even contribute that sort of qualitative stat

[-] [email protected] 1 points 1 month ago

Yes it is the ratings on winehq, https://appdb.winehq.org/

And yes, an average user probably going to fire a game, figure out it is not working, and promptly go back to windows, which makes that data less accurate, but what can we do about it?

[-] [email protected] 2 points 1 month ago

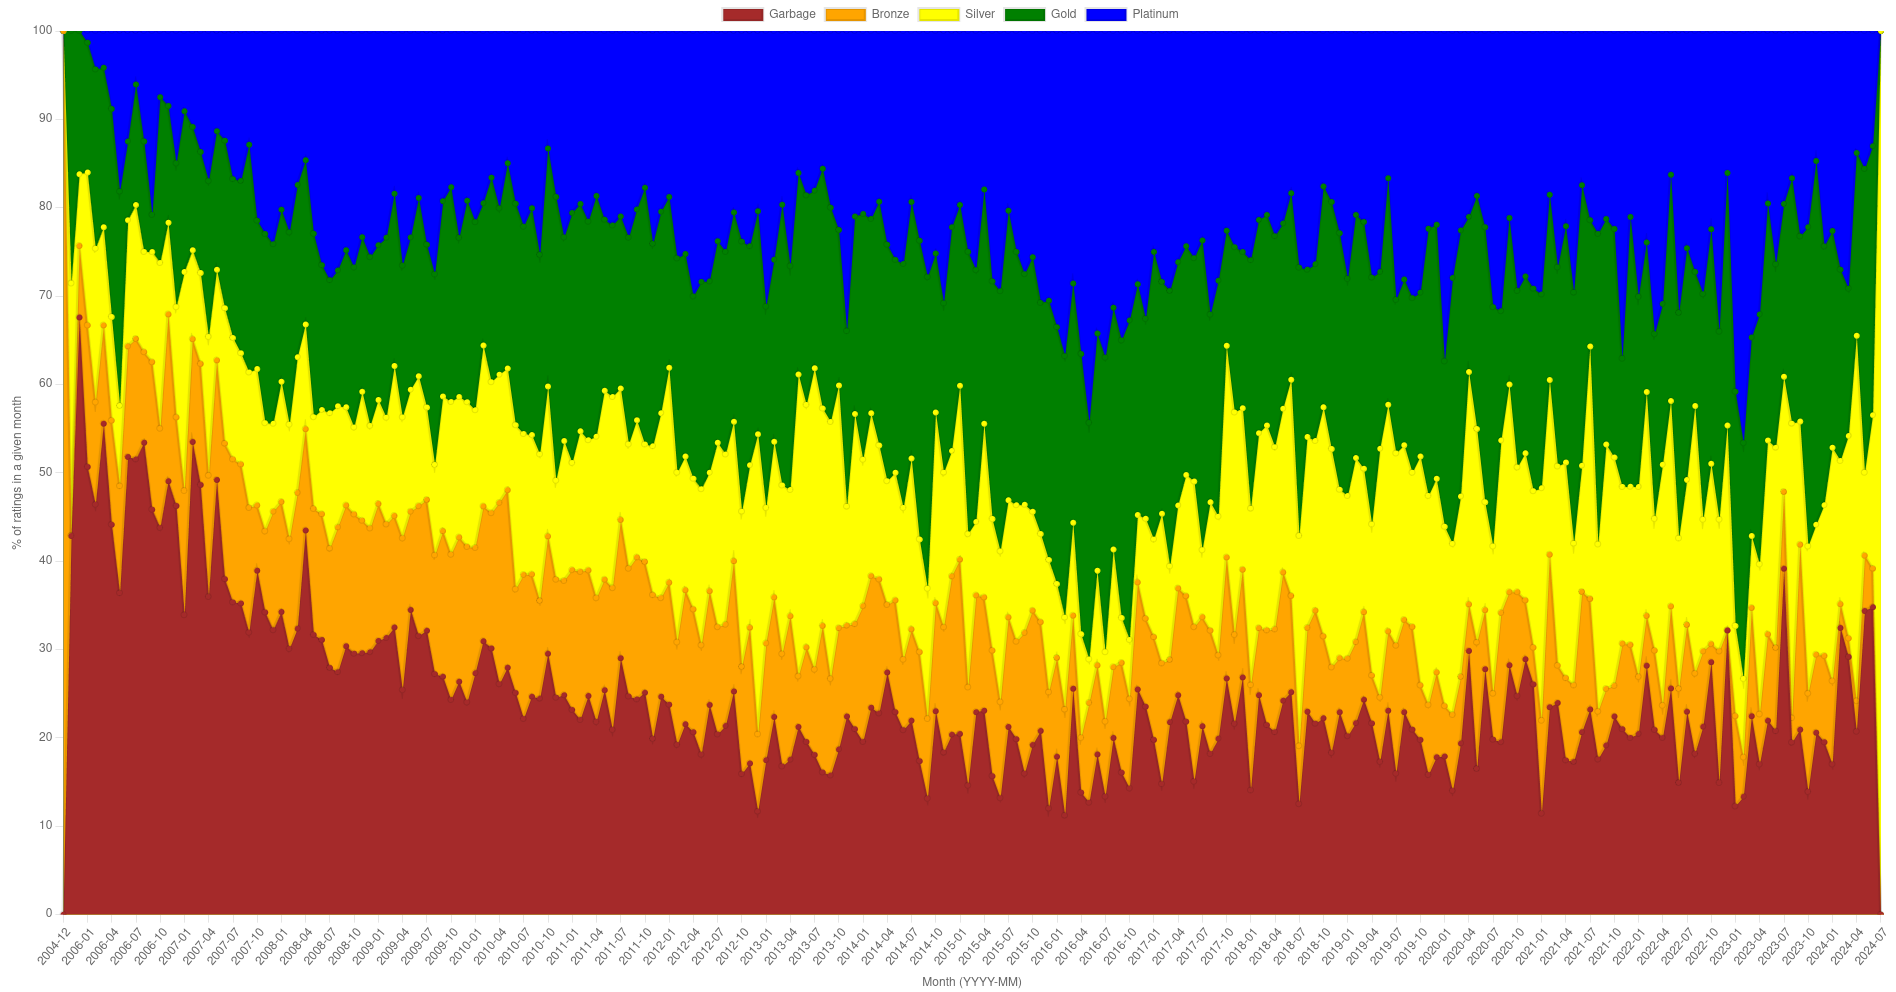
Could you please plot this as a 100% area chart instead?

[-] [email protected] 3 points 1 month ago
[-] [email protected] 1 points 1 month ago

That is a very different picture, isn't it!

[-] [email protected] 3 points 1 month ago

It's the same picture.

this post was submitted on 28 Jul 2024
113 points (99.1% liked)

Linux

47293 readers
930 users here now

From Wikipedia, the free encyclopedia

Linux is a family of open source Unix-like operating systems based on the Linux kernel, an operating system kernel first released on September 17, 1991 by Linus Torvalds. Linux is typically packaged in a Linux distribution (or distro for short).

Distributions include the Linux kernel and supporting system software and libraries, many of which are provided by the GNU Project. Many Linux distributions use the word "Linux" in their name, but the Free Software Foundation uses the name GNU/Linux to emphasize the importance of GNU software, causing some controversy.

Rules

Related Communities

Community icon by Alpár-Etele Méder, licensed under CC BY 3.0

founded 5 years ago
MODERATORS