this post was submitted on 07 Nov 2023
19 points (91.3% liked)
NBA
5099 readers
16 users here now
| East - Atlantic |
|---|
| Boston Celtics |
| Brooklyn Nets |
| New York Knicks |
| Philadelphia Sixers |
| Toronto Raptors |
| East - Central |
|---|
| Chicago Bulls |
| Cleveland Cavaliers |
| Detroit Pistons |
| Indiana Pacers |
| Milwaukee Bucks |
| East - Southeast |
|---|
| Atlanta Hawks |
| Charlotte Hornets |
| Miami Heat |
| Orlando Magic |
| Washington Wizards |
| West - Northwest |
|---|
| Denver Nuggets |
| Minnesota Timberwolves |
| Oklahoma City Thunder |
| Portland Trailblazers |
| Utah Jazz |
| West - Pacific |
|---|
| Golden State Warriors |
| Los Angeles Clippers |
| Los Angeles Lakers |
| Phoenix Suns |
| Sacramento Kings |
| West - Southwest |
|---|
| Dallas Mavericks |
| Houston Rockets |
| Memphis Grizzlies |
| New Orleans Pelicans |
| San Antonio Spurs |
founded 1 year ago
MODERATORS
you are viewing a single comment's thread
view the rest of the comments
view the rest of the comments

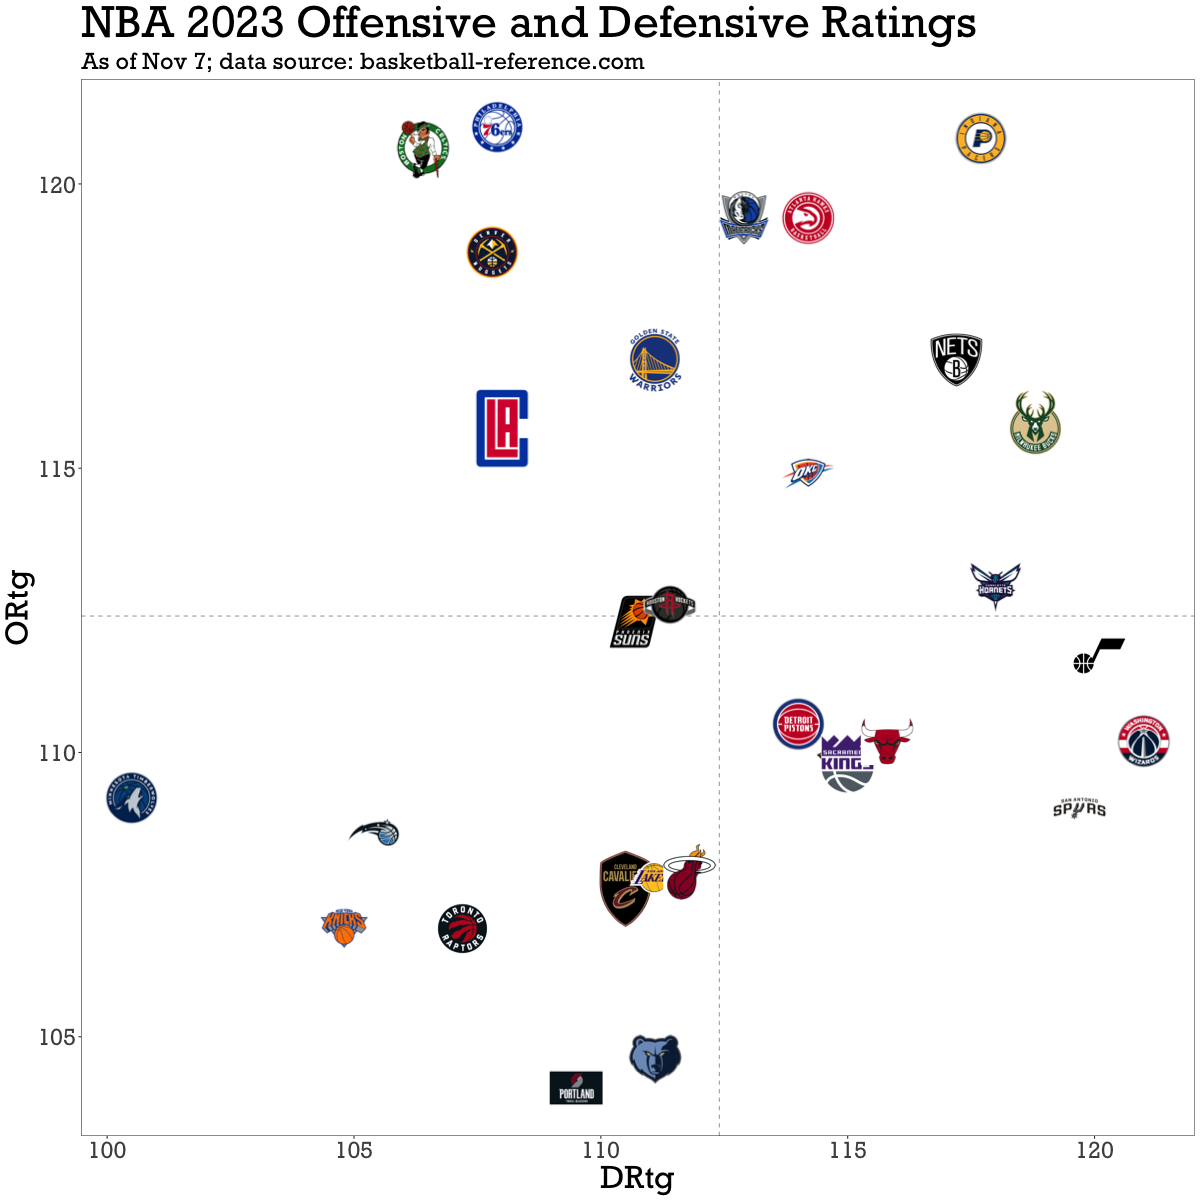
good work plotting the ratings, it is a very welcome addition to this community :)
some suggestions for the next version of the chart: (- inverting Drtg axis was already suggested before)
Great suggestions, thank you!! I'd written this code during the summer for an MLB plot (EPA+ and OPS+, which are standardized), had some downtime today, and decided to give this a quick shot