Some more screenshots:
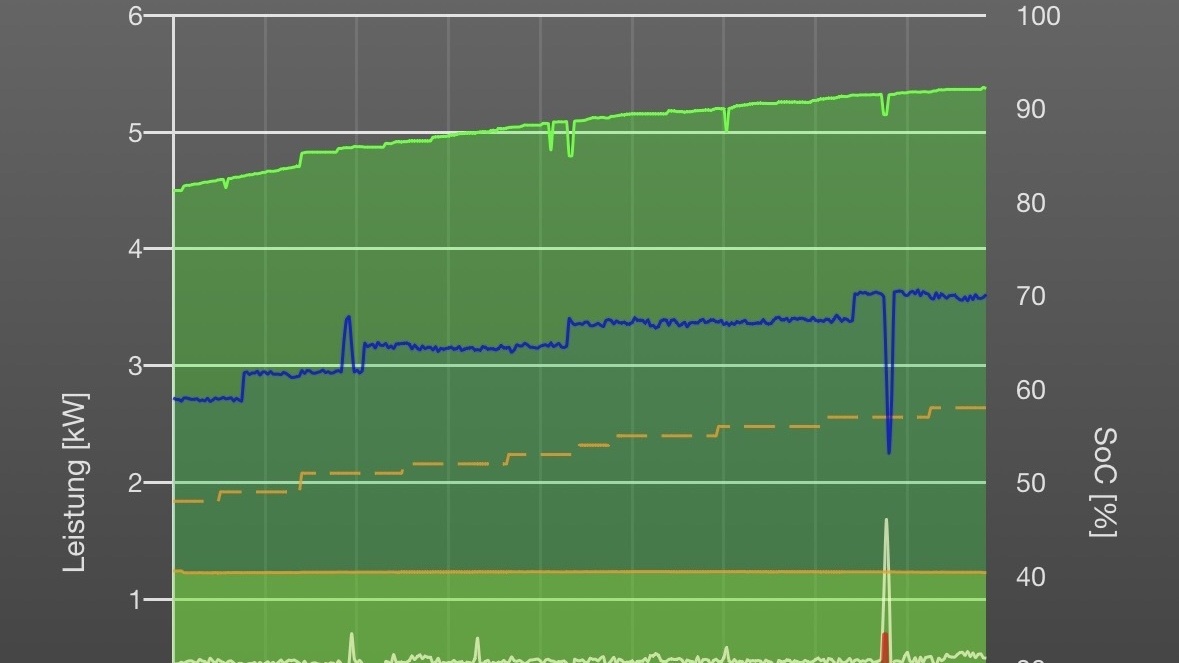
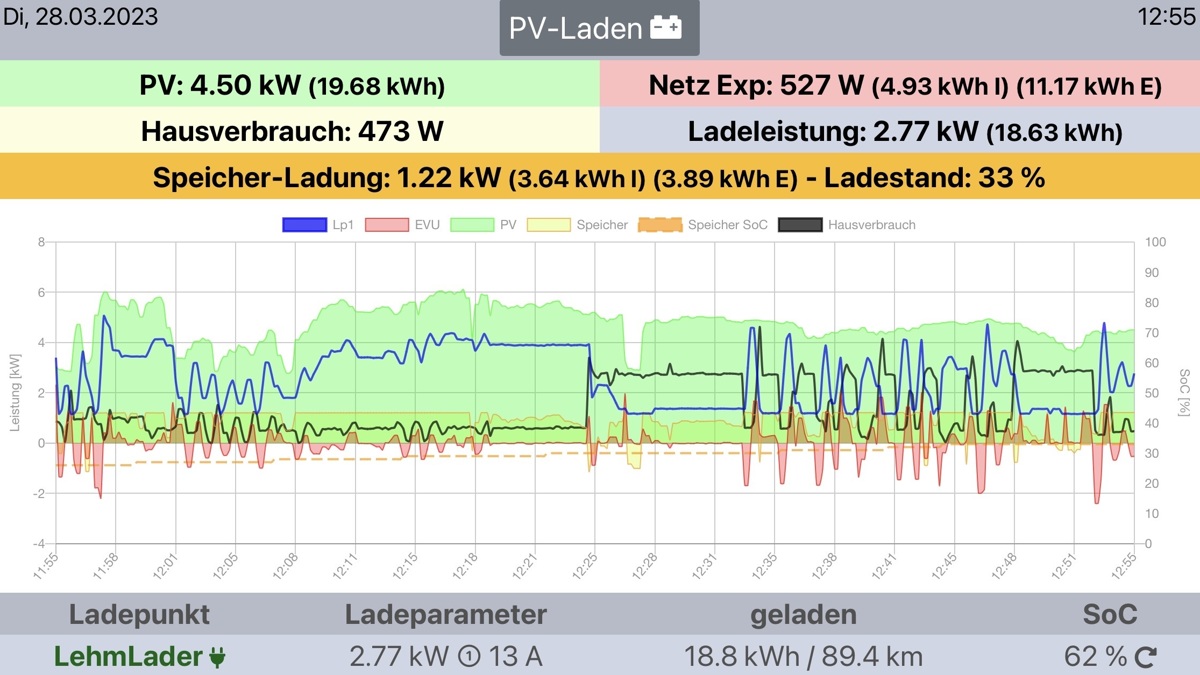
Green is solar production steadily increasing during the morning.
Orange is the constant charging of the house Battery. We have a 10 kWh Battery but carge only op to 70% to incerase it’s lifetime.
Yellow is the house consumption. No idea what the spike at 8:45 is.
Blue is te EV charging power constantly increasing as the PV power goes up.
Compare this to the the more turbulent situation at 9:00h:
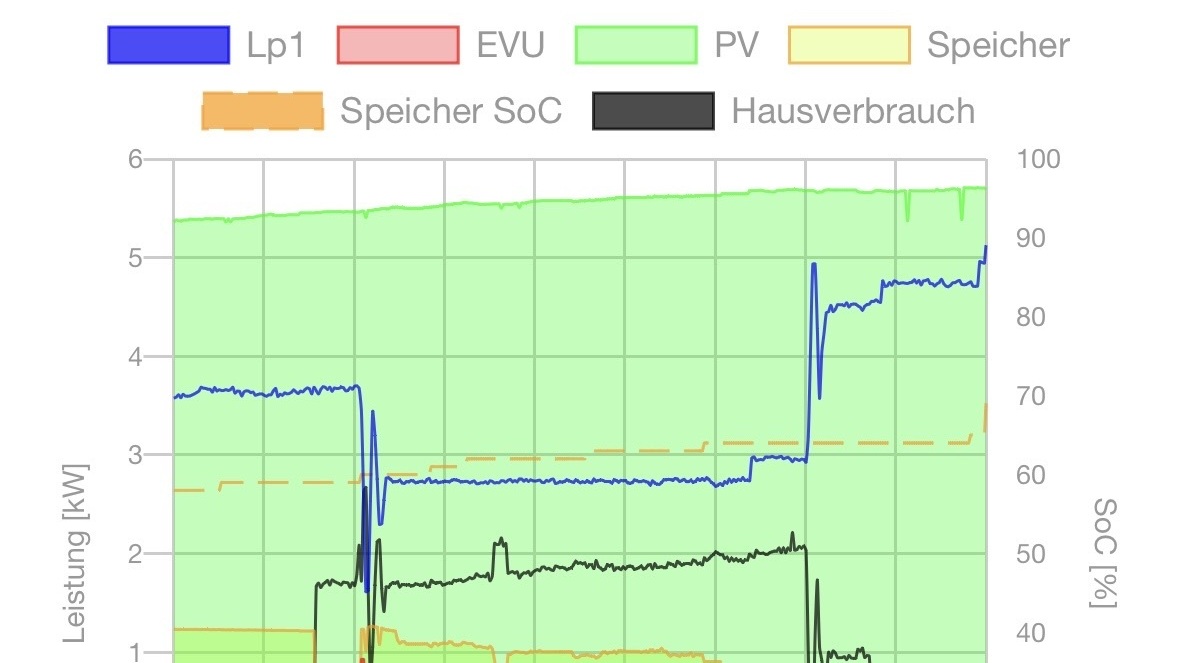
I take a shower and the hearpump kicks in to replace warm water in the storage tank thus the house consumption (here black not yellow) inceraseses.
At first this means charging of the house battery (orange) drops to nearly zero.
At 9:05 reduction of EV charging kicks in to give the house battery priority.
At 9:30 you se hoys battery charging go sliwer because we nearly reached it’s maximum charge.
At 9:40 heat pump is done but I make a coffee. Then at 9:40 nearly all power is used for EV charging.
all this works completely automated intense of. These are commercially available easy products. Only the nerds look inside what’s actually happening.
This example is driven by my own PV, but it is trivial to drive it by power prices or country wide power production.
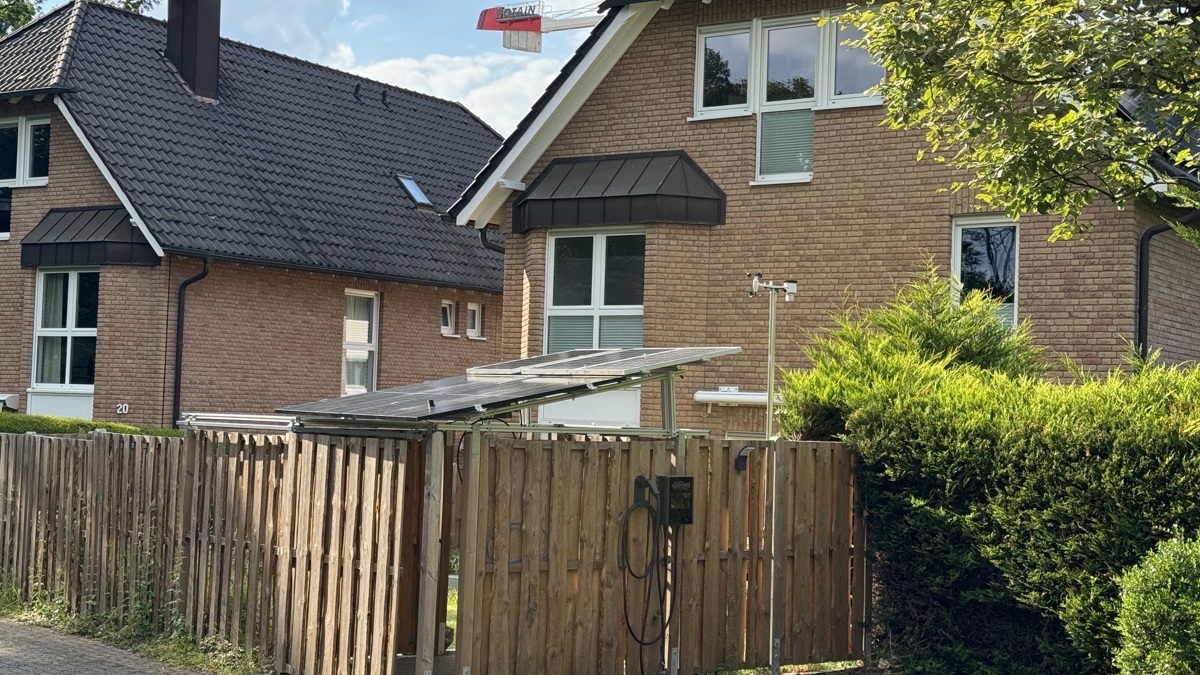
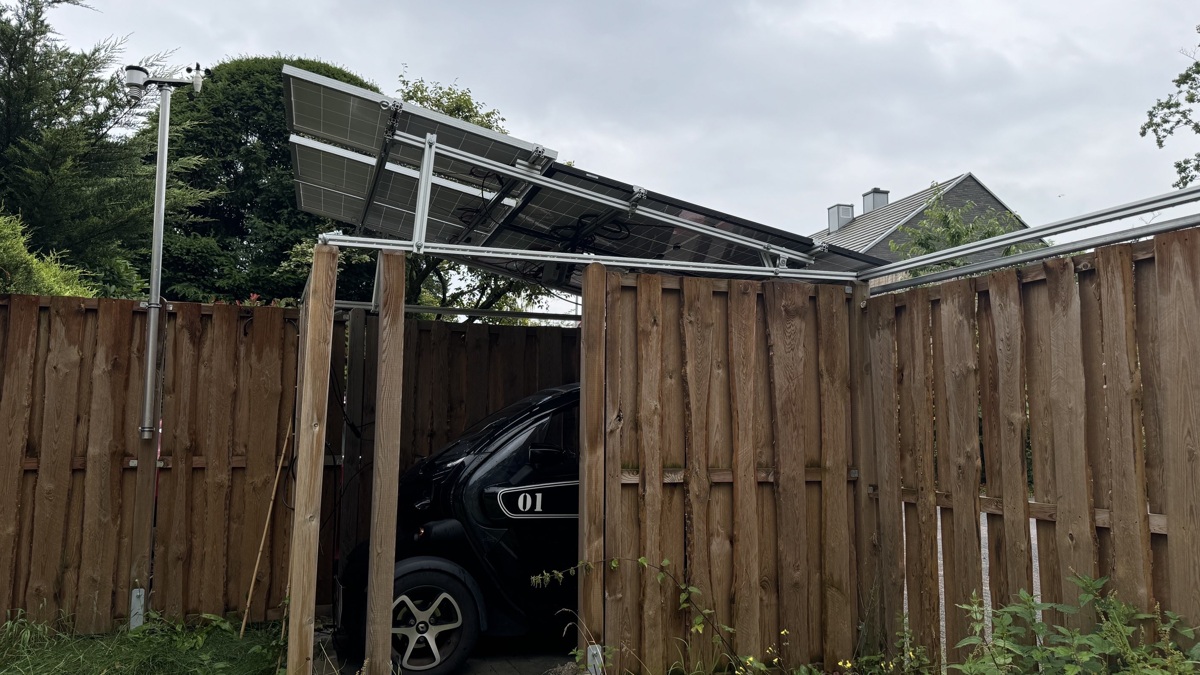
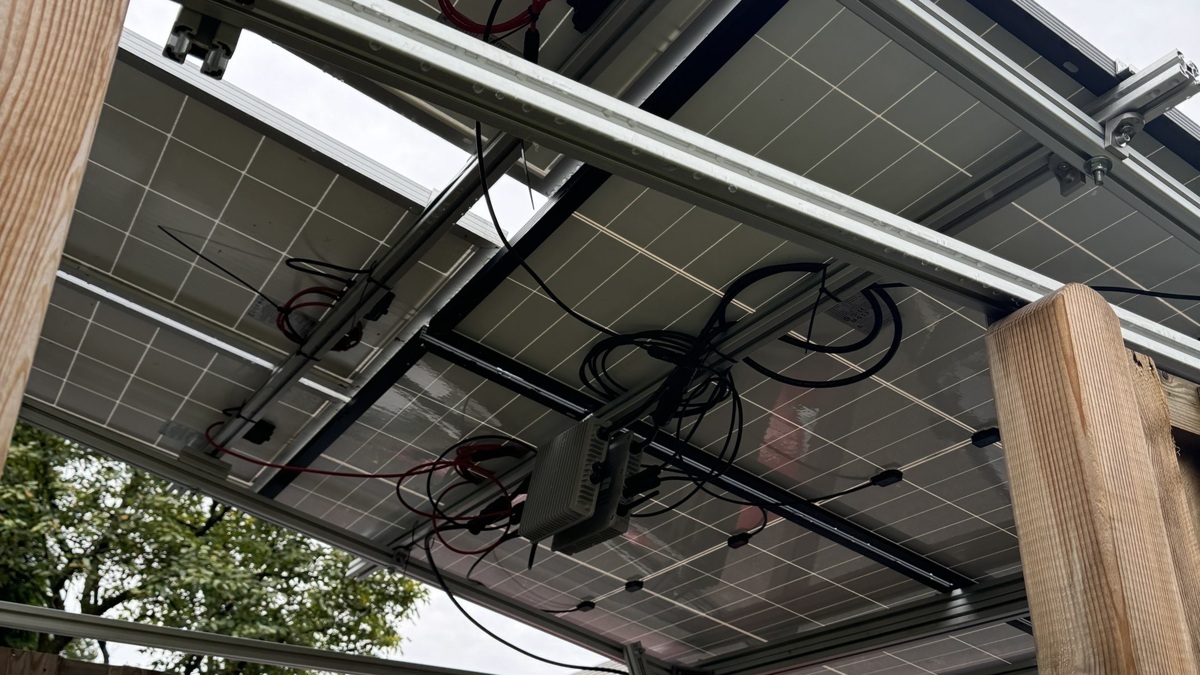



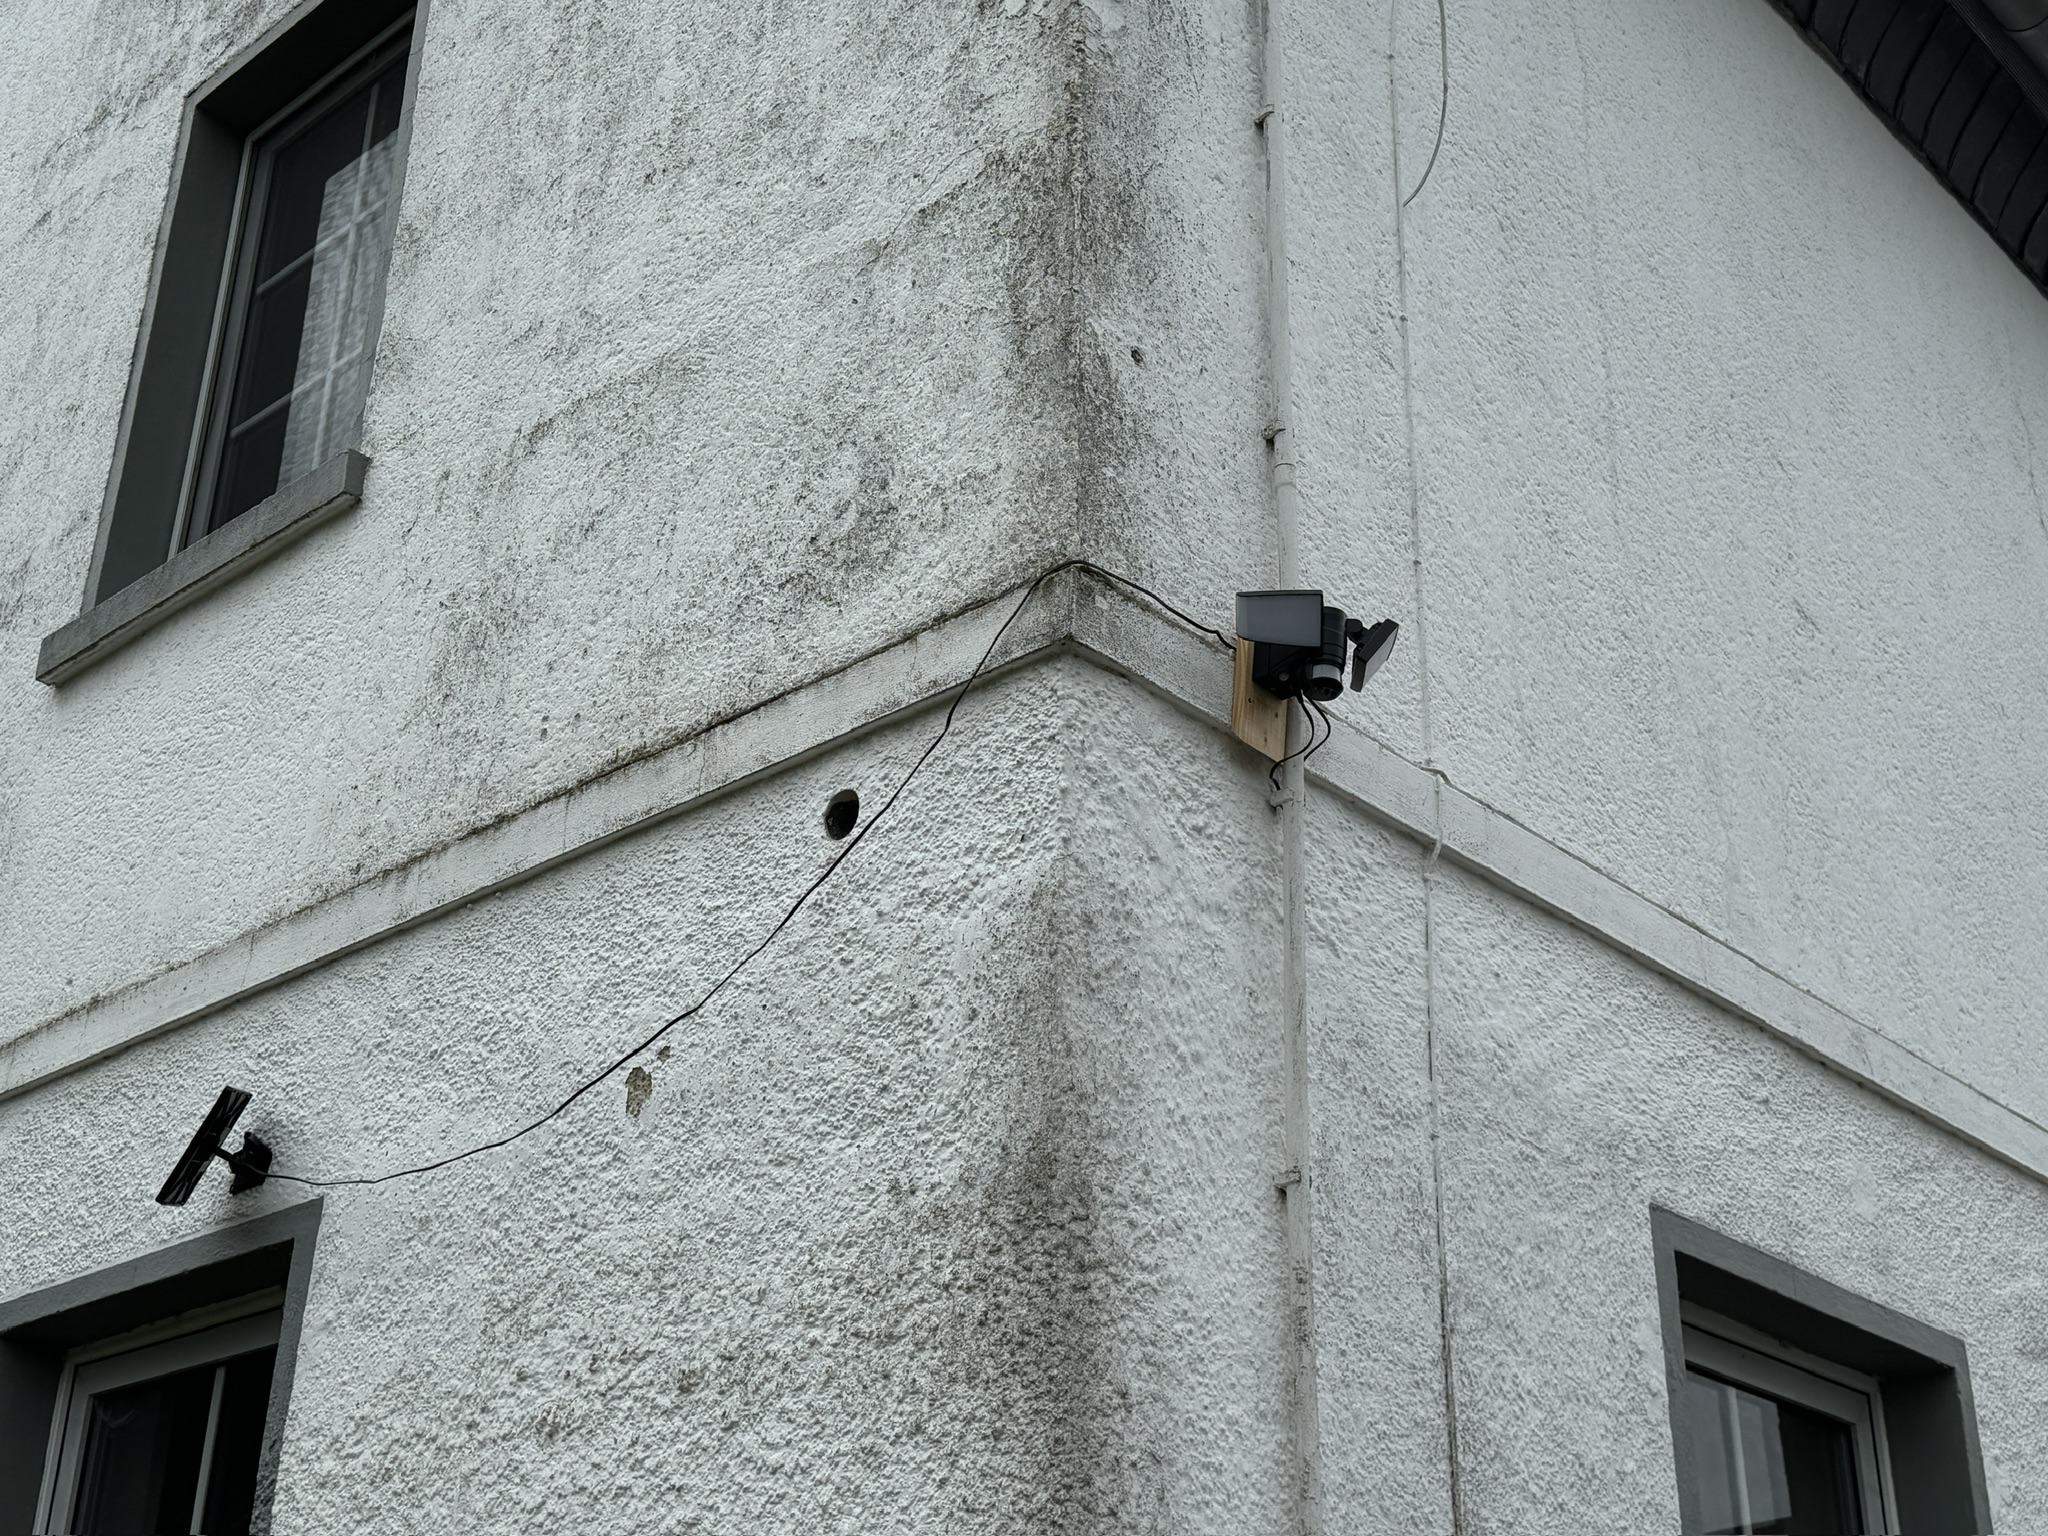
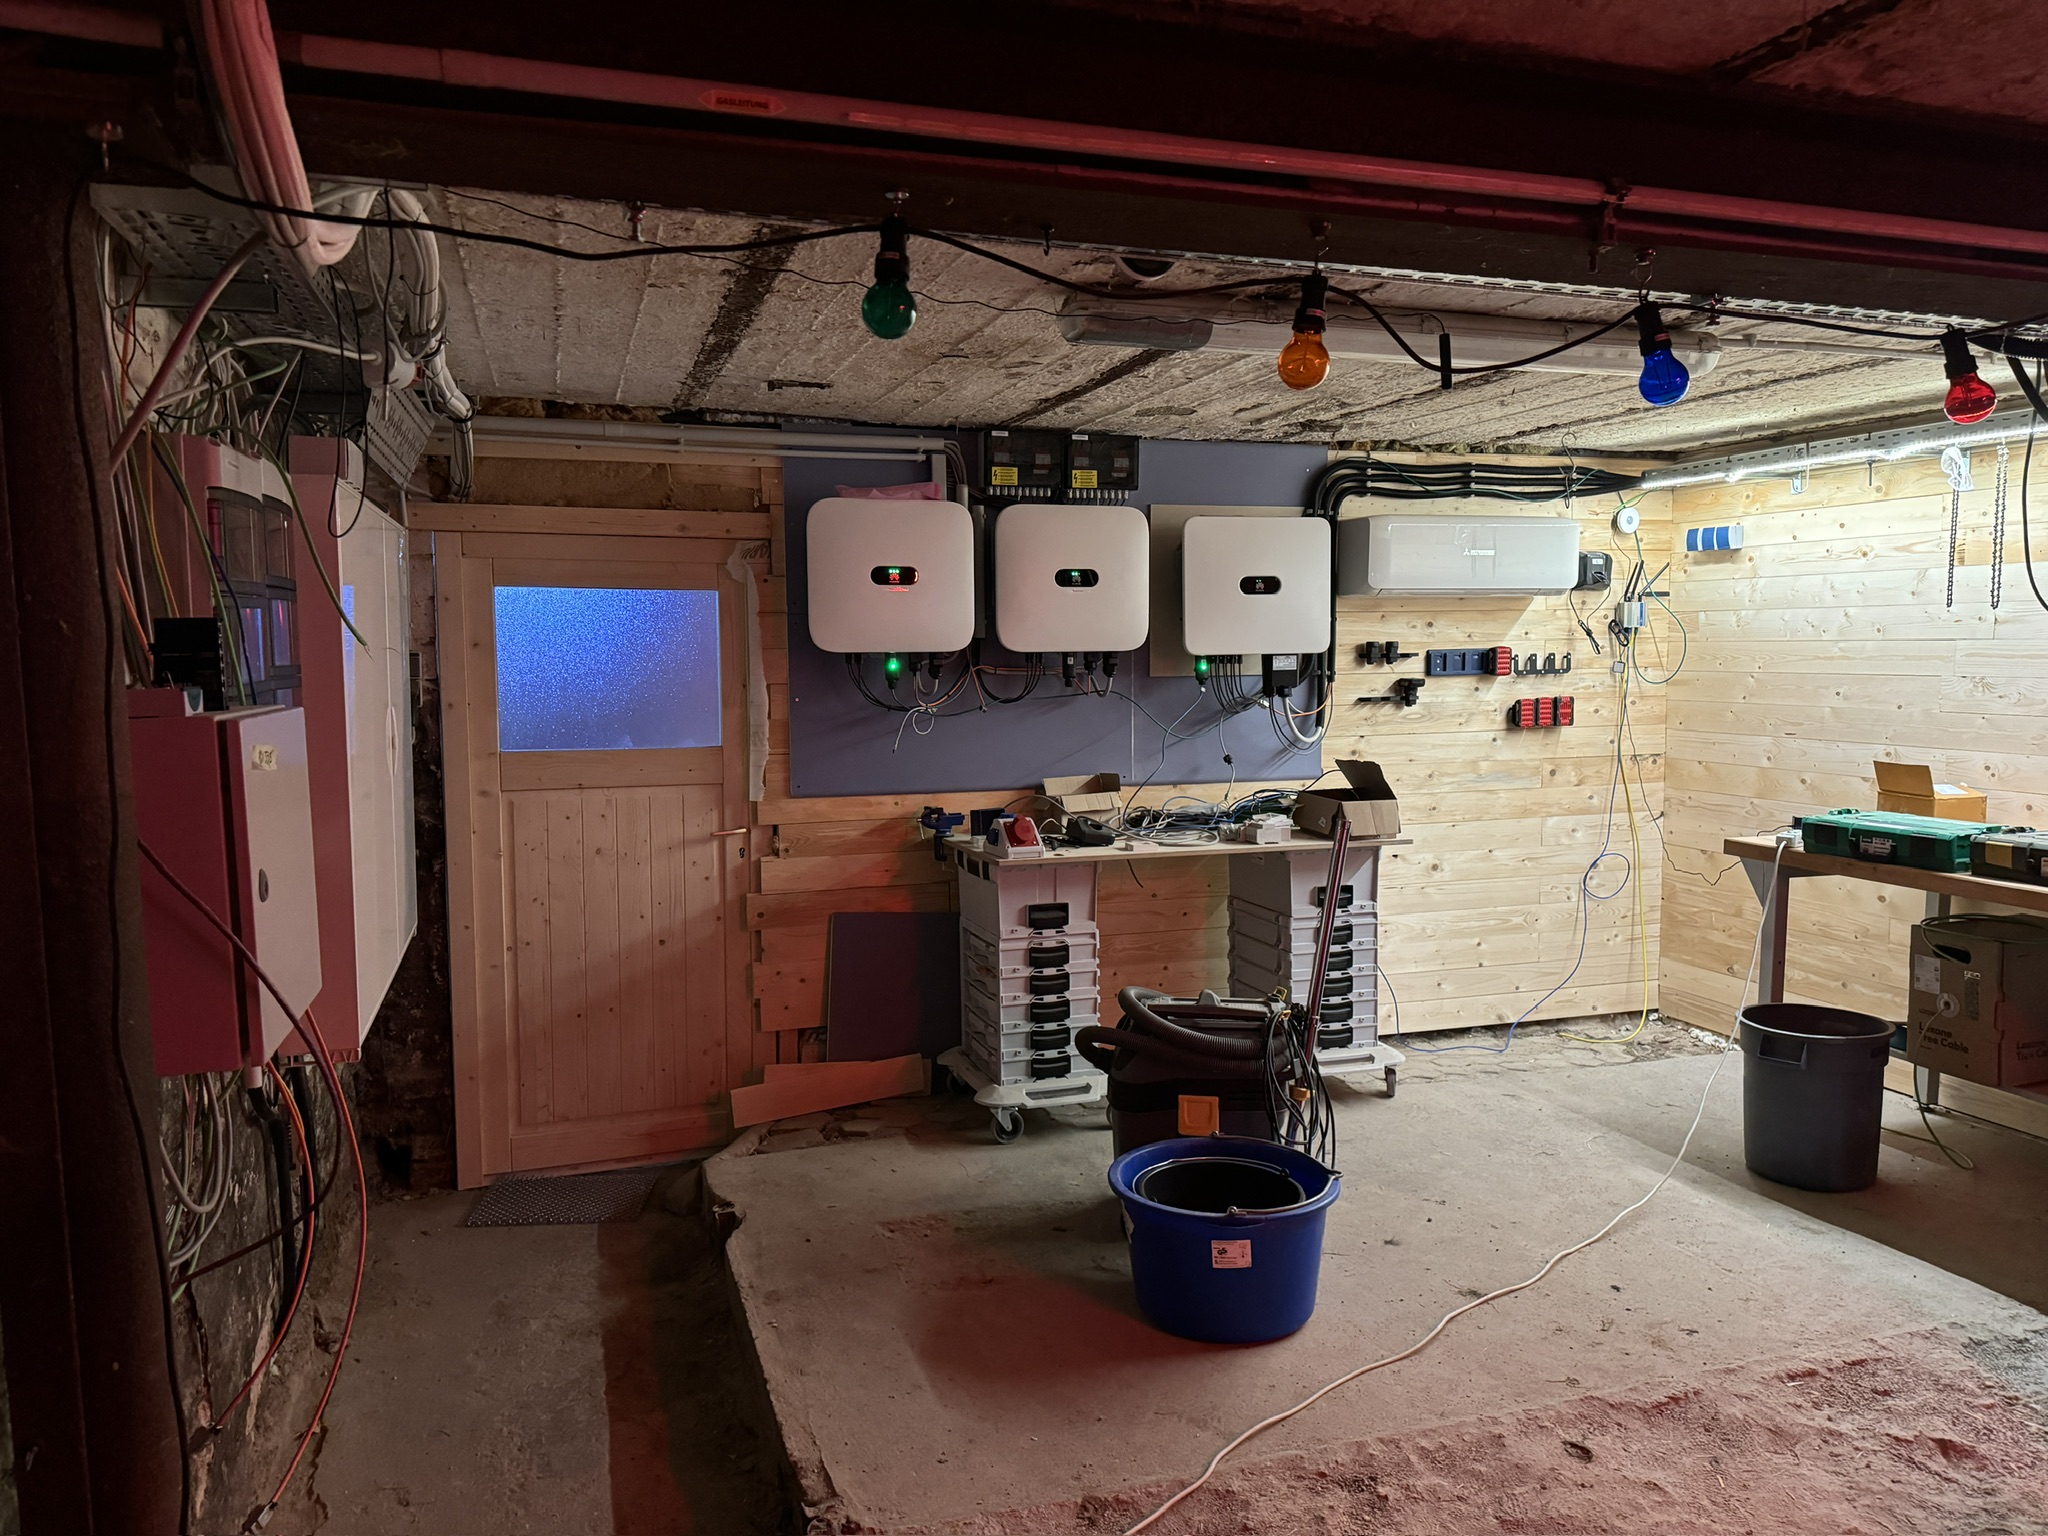
The 230 V power just is connected to the mains.
Up to 800 W rated inverter power you don’t need a permit under current german law.
If I do not use the power in my house it will just flow back into the electrical grid.
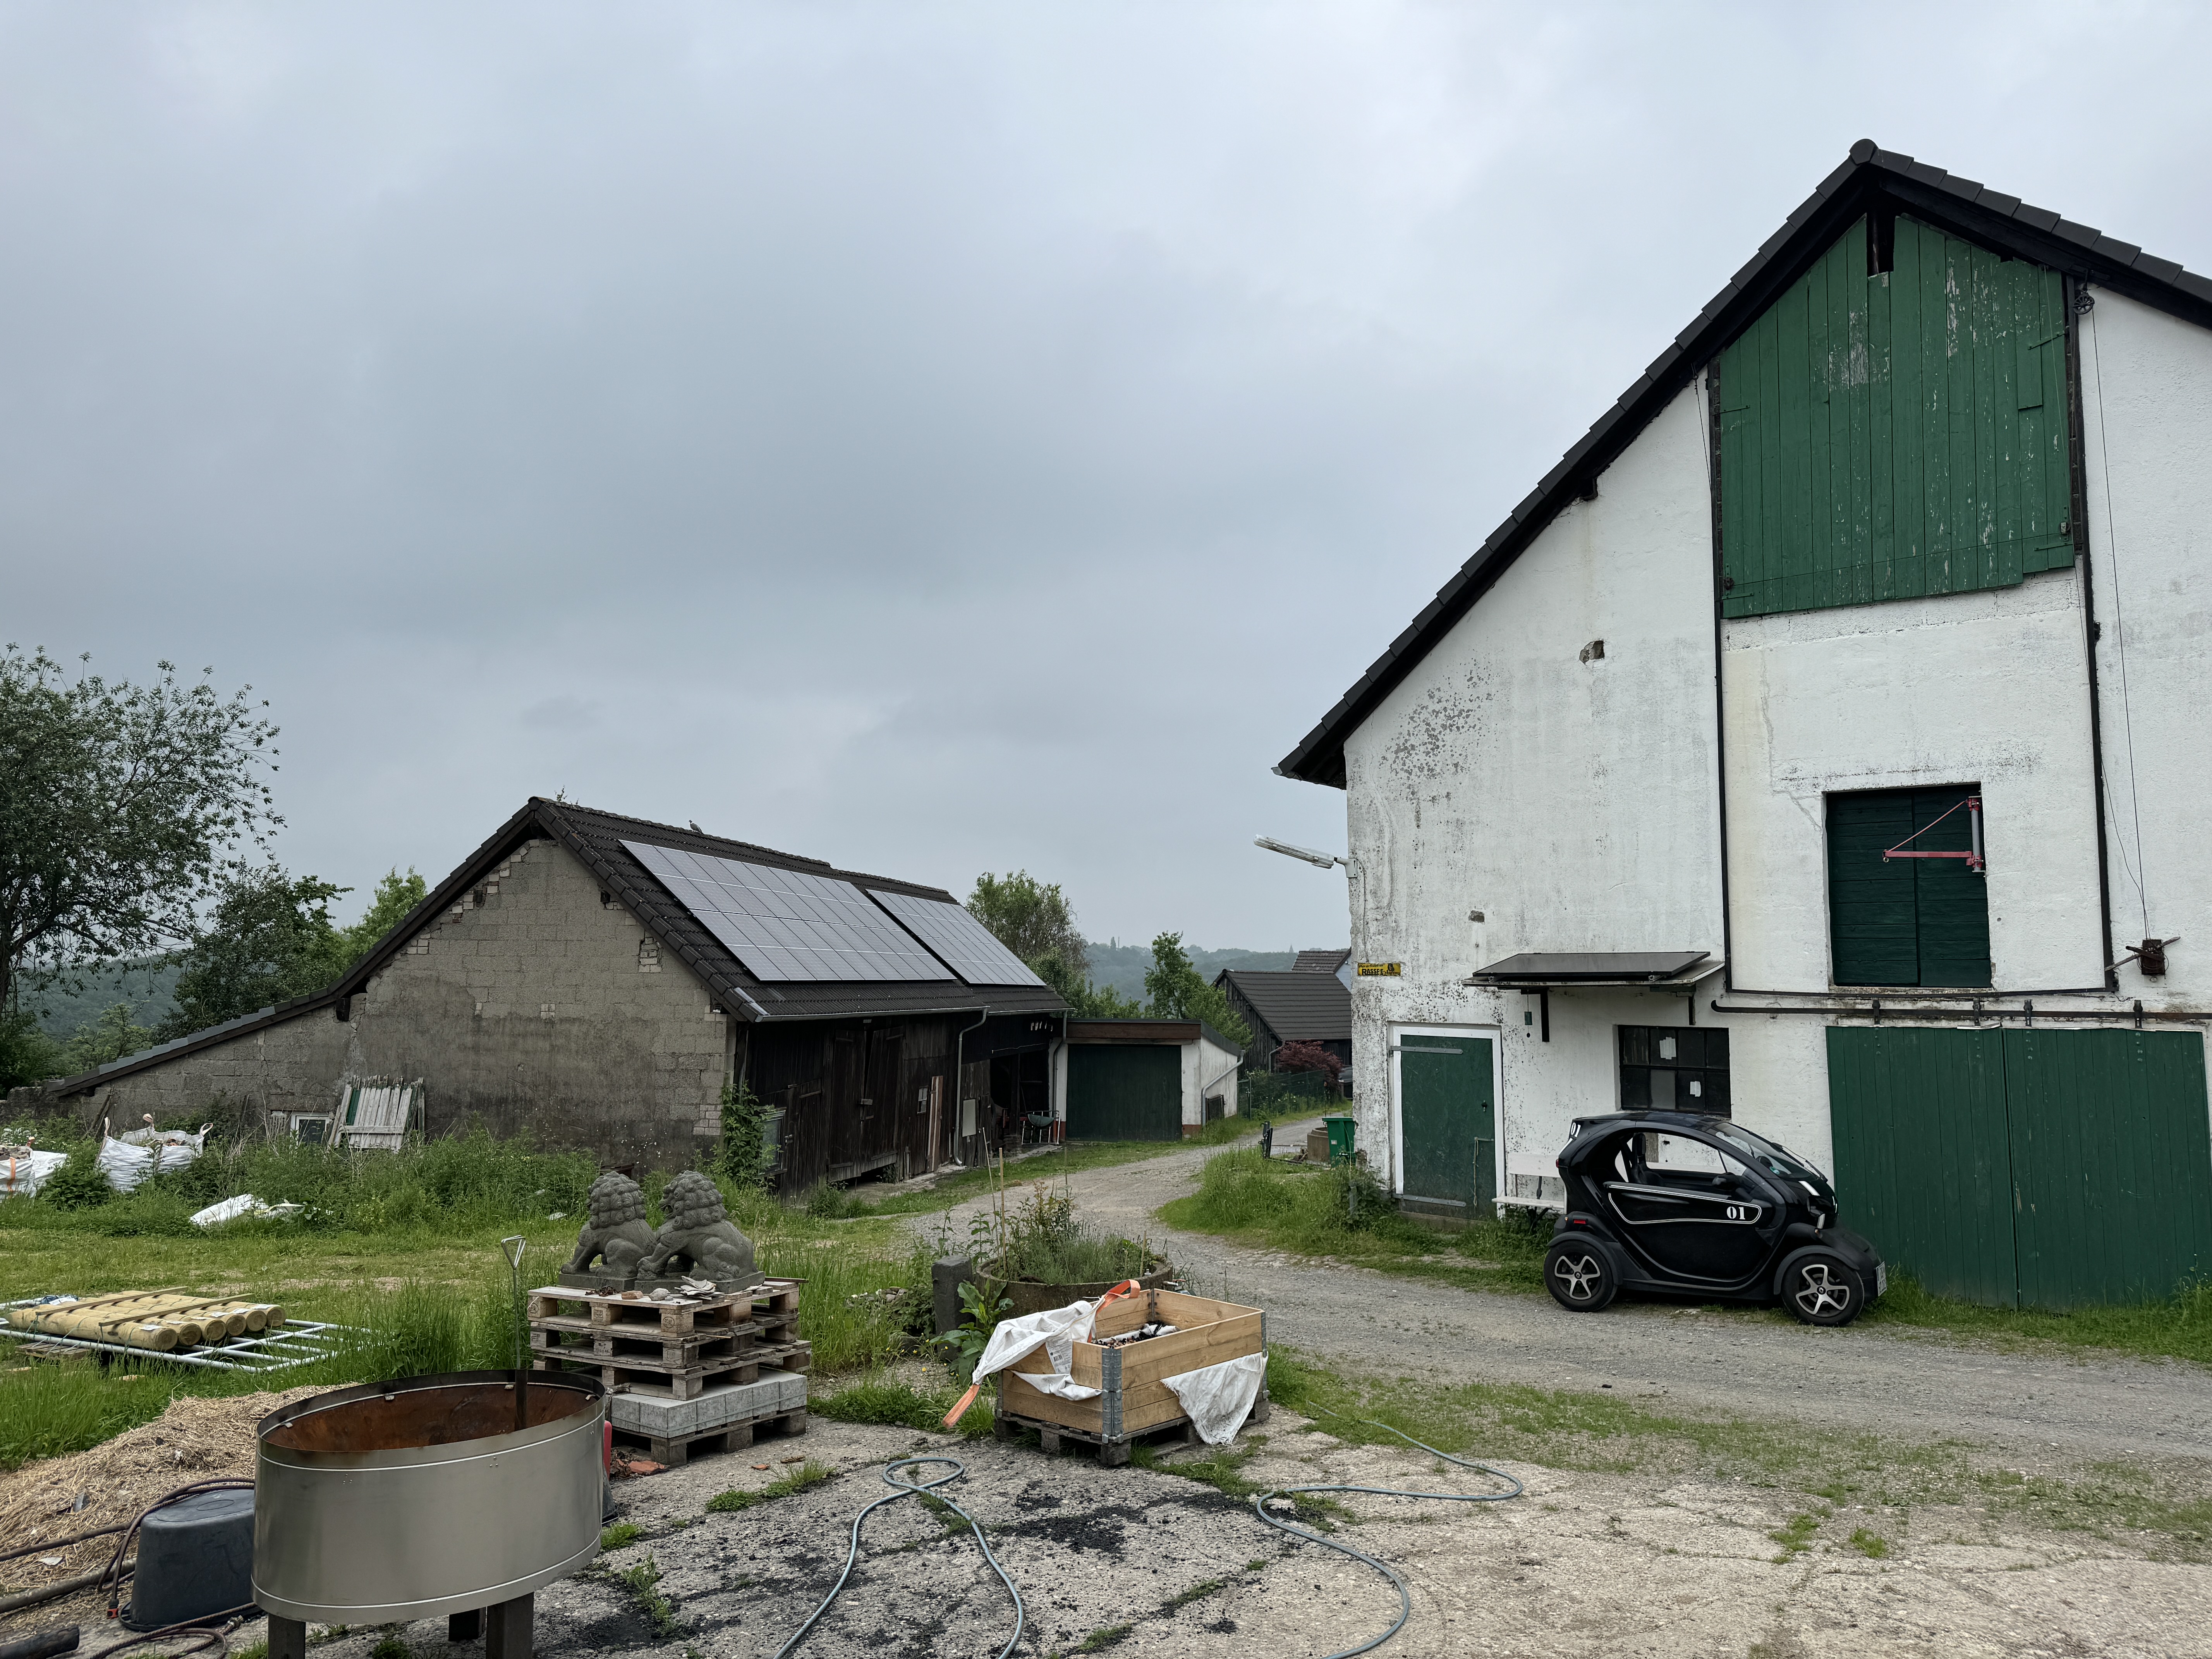
For EV charging this shed produces not enough power. Charging the Twizy would need 3 days with optimal sun. Charging the Tesla about four weeks.
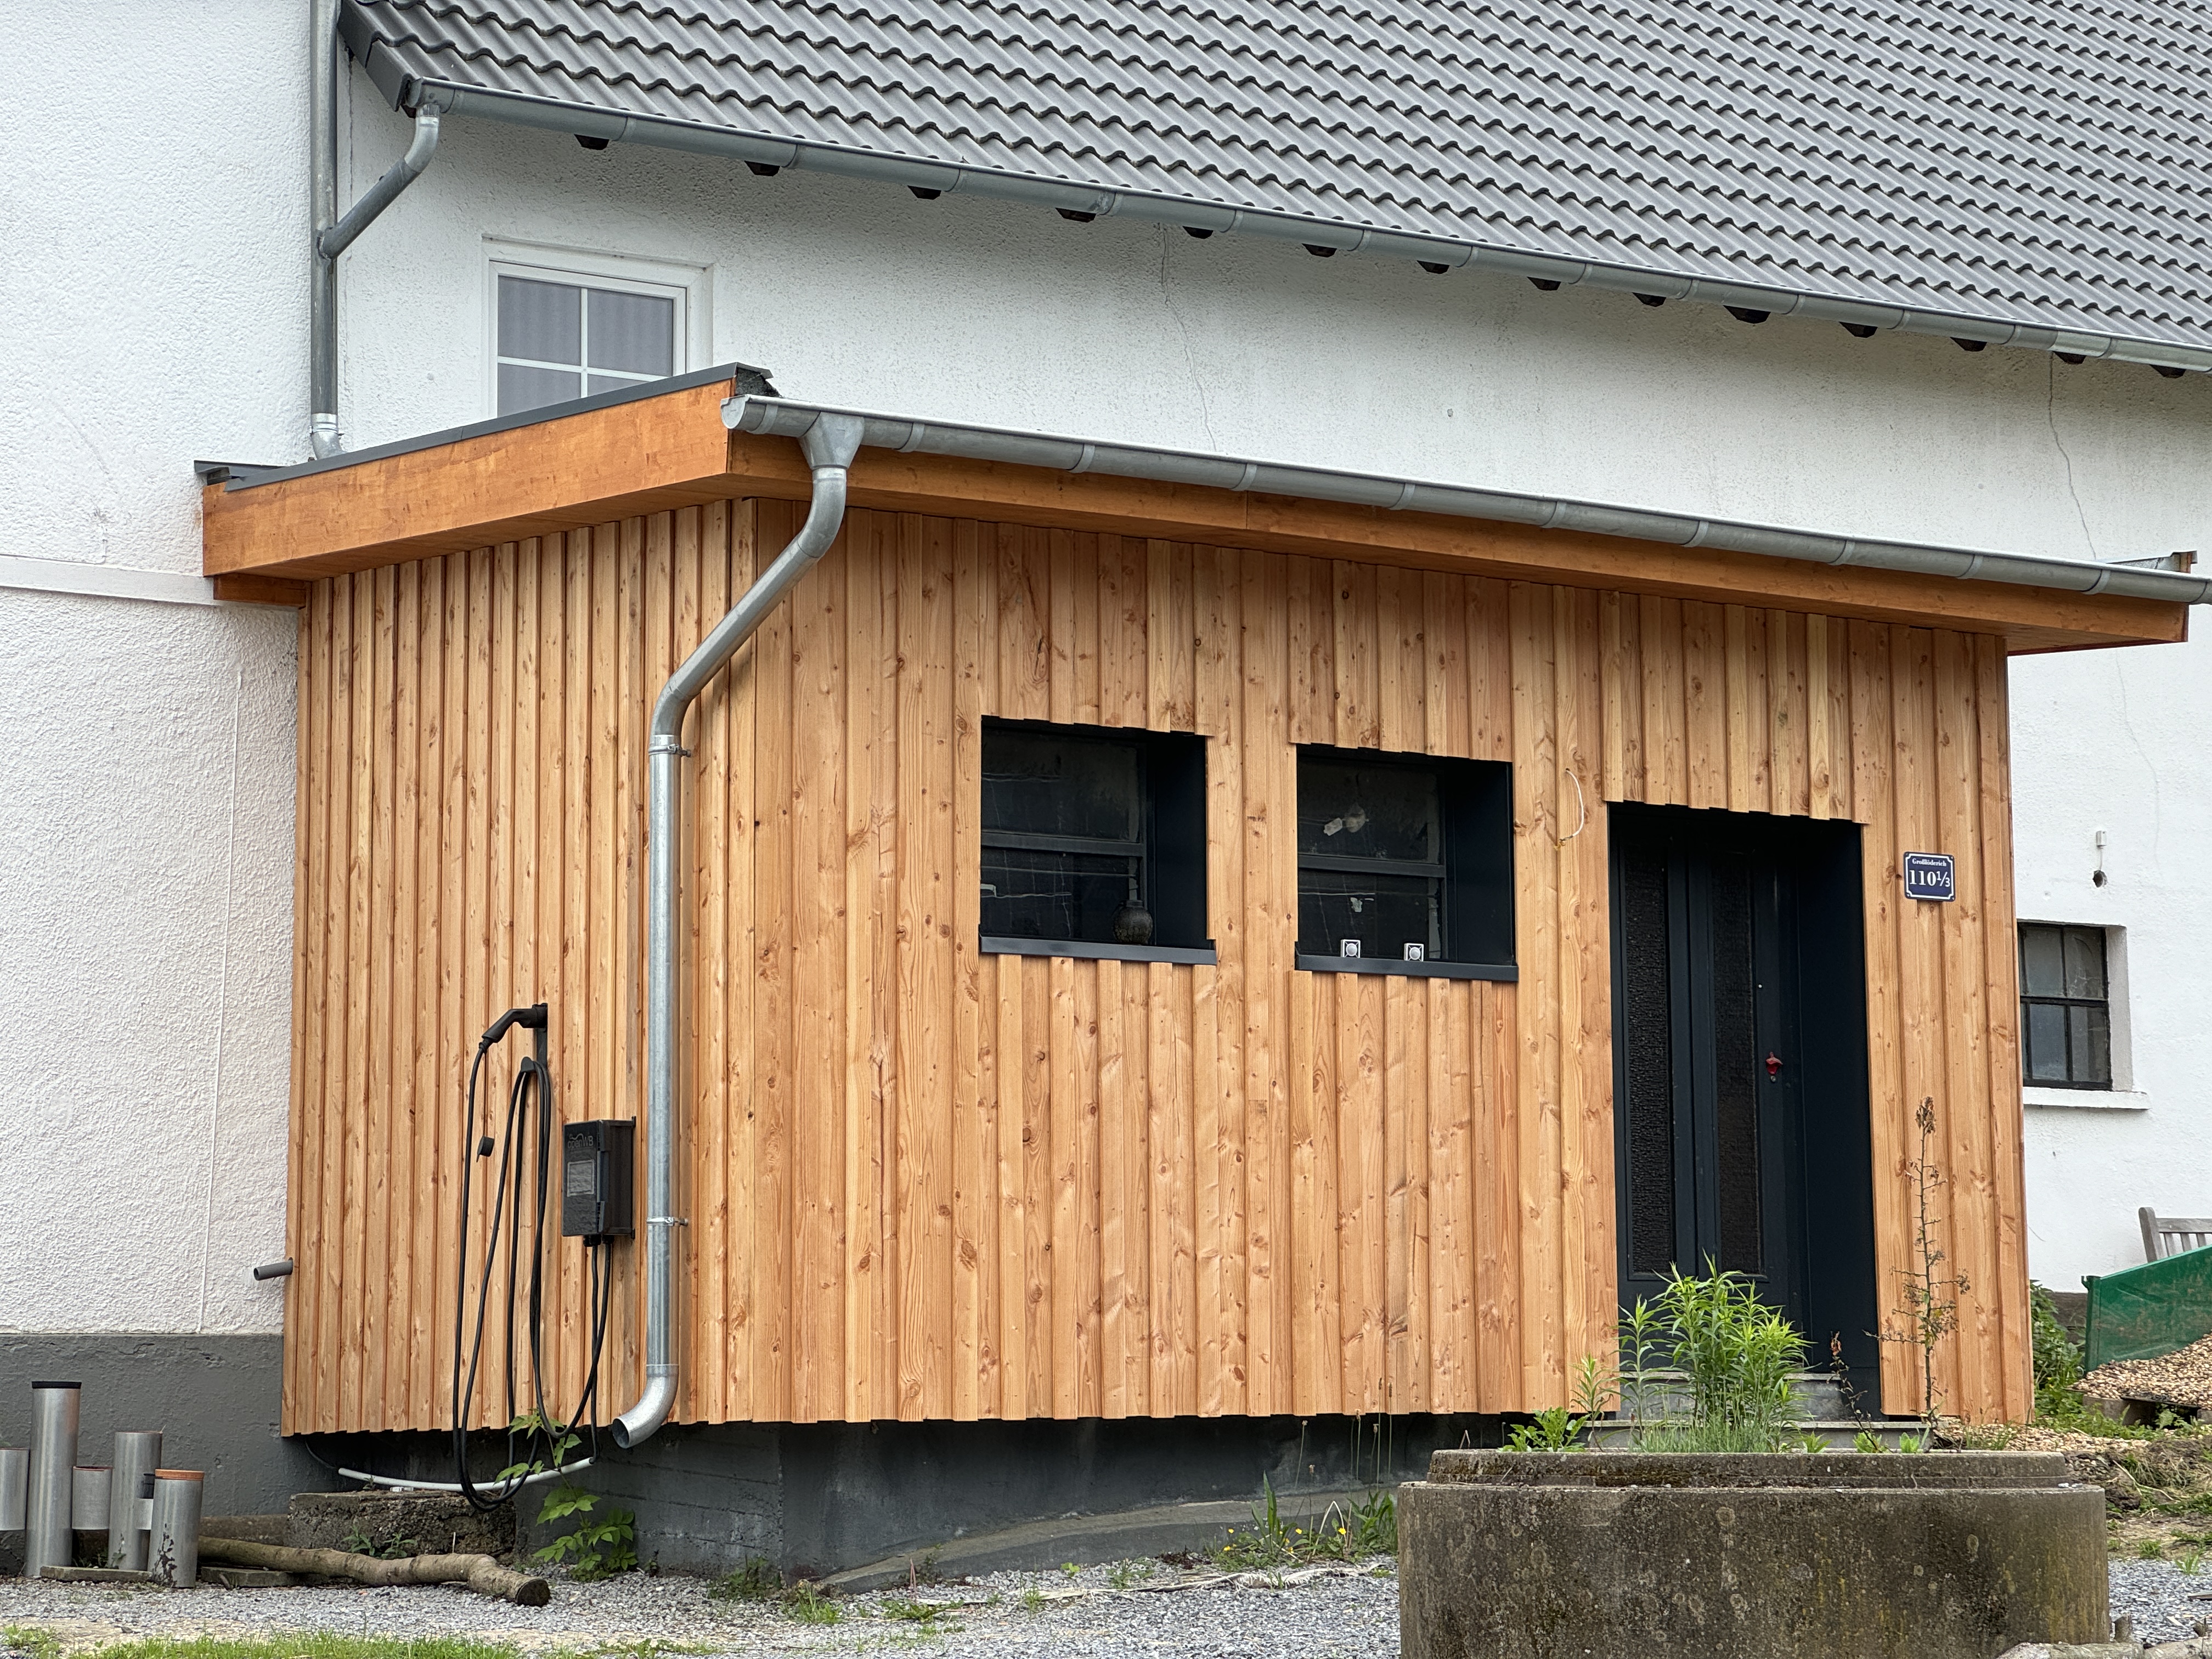
But there is a separate 10500 Wp solar array on the house and an energy management system which controls everything charging. See OpenWB on how this can be done.