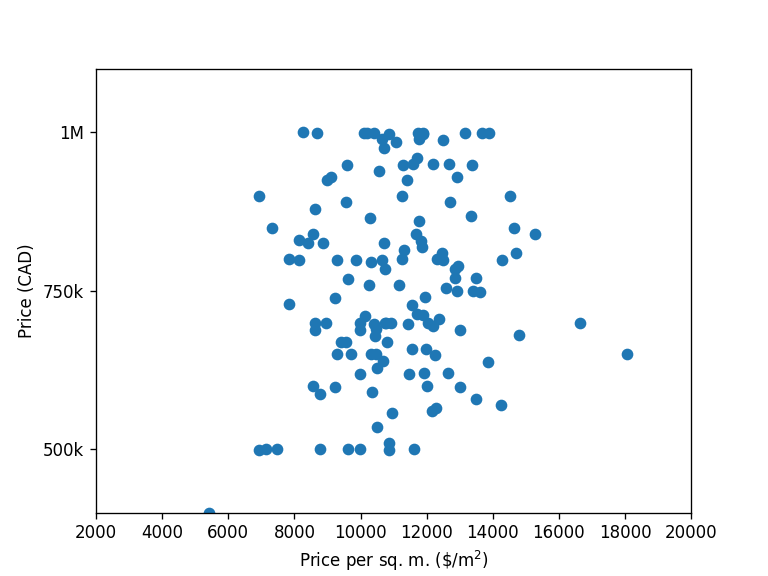
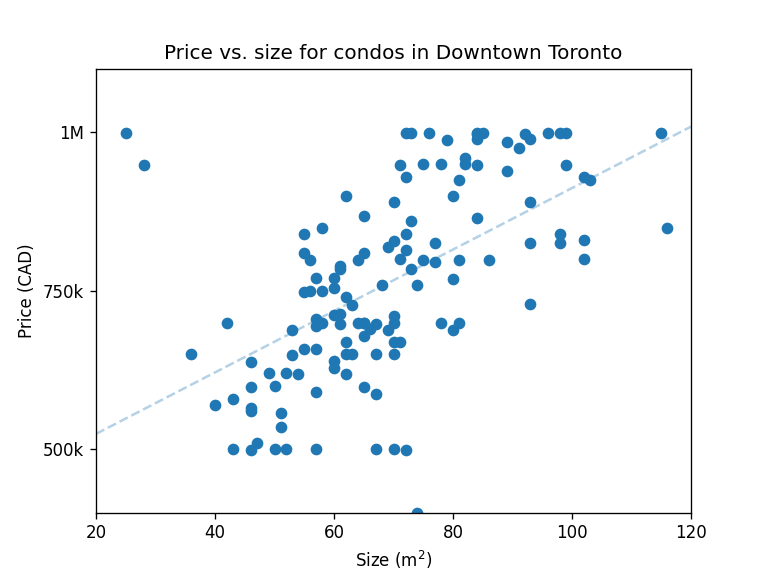
Not sure it's useful for anybody, but today I learned that condos that are of interest to me (Downtown Toronto and nearby, in the $400k-1M range) go for approx $11,000 per square metre, ±$4000. This graph is made from 136 current listings. Some curious outliers there, but it could be an artifact of how the data are obtained.
Personal Finance Canada
Come and discuss anything related to personal finance, directly or indirectly, with other Canadians!
Quite interesting. I'd be curious to see the same graph but based on the price per square meter. I'm curious, how do you plan to use this data?
Looks like there's no correlation really. I'm using these data just to learn the market and make an informed purchase hopefully over the coming months. Not just the price and size, but everything I can scrape from the internet. I'm just at the early stages of analyzing what I have.
Interesting, I wasn't expecting that. I though the $/m2 would decrease with the increase in size, and then go back up when your entered the realm of luxurious RE. I would be so great if the data on realtor.ca was available freely to run these kinds of statistical analysis.
It could very well be, it's just that this dataset excludes anything above $1M. I excluded that partly because indeed these data are not freely available, so I only scrape what I need. Realtor.ca is actually quite good at detecting automated requests ("bots") so can't be too greedy 😅