this post was submitted on 13 Mar 2024
1083 points (93.8% liked)
Technology
59583 readers
3834 users here now
This is a most excellent place for technology news and articles.
Our Rules
- Follow the lemmy.world rules.
- Only tech related content.
- Be excellent to each another!
- Mod approved content bots can post up to 10 articles per day.
- Threads asking for personal tech support may be deleted.
- Politics threads may be removed.
- No memes allowed as posts, OK to post as comments.
- Only approved bots from the list below, to ask if your bot can be added please contact us.
- Check for duplicates before posting, duplicates may be removed
Approved Bots
founded 1 year ago
MODERATORS
you are viewing a single comment's thread
view the rest of the comments
view the rest of the comments

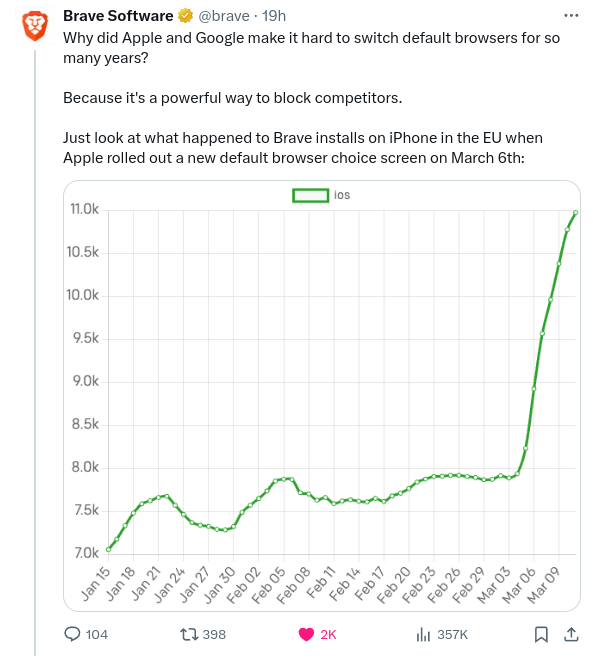
Chart is a little misleading starting at 7% instead of zero, but still a nice surge nevertheless.
True. Other people asked so they posted another one.
IMO, this makes it look even worse.
That's why they started with the one they did
Even then, this is still a solid 30-40% increase in downloads. That's statistically significant right there.
Worse, or... "better"?
Does not look as nice, but is way less misleading
The total numbers are so small that the shape of the line barely matters. 7-10k installs daily? In the mobile browser market? There are plant identification apps with better numbers.
Is that 7% or 7,000 installs total? The axis isn’t labeled!!
I see a k following the numbers, so I'm assuming that's total number of downloads.
Article states installs per day
Not even seven percent. Lol. Seven thousand which is probably like .0001 percent.
That's new daily installs though, so cumulative number. I don't think they're trying to draw a comparison, just show the increase.