1
LabPlot Data Analysis and Visualization Software
112 readers
2 users here now
KDE's data visualization and analysis software. LabPlot is free, open source, works on Linux, WIndows and macOS, and is accessible to everyone.
Share here your tips, tricks and resources, request help, talk to the maintainers and devs, read LabPlot news, connect with other users.
founded 1 year ago
MODERATORS
2
Hi all,
I just started using labplot. Mainly for visualization so far. I am currently plotting stuff in a line plot. For some reason I cannot figure out how to properly align my x-axis. If I reduce the data range my gridlines overextend. If I increase the x-axis range the axis just extends over my data.
Anyone know how to make this fit.
Sorry for the basic question but I have been banging my head against this for 2 days now and just can't figure it out.
If you have some good material beside the videos and documentation I am also happy to just take a link.
Thanks :)
edit: I use LabPlot 2.10.0 on Windows
3
1
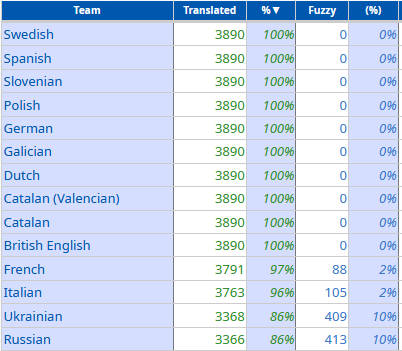
#LabPlot is currently fully available in British English, Catalan, Dutch, Galician, German, Polish, Slovenian, Spanish, Swedish and partially available in French, Italian, Ukrainian, Russian and other languages.
We would like to thank all LabPlot's translators and encourage others to provide translations in other languages ❤️ 🙂
Check translation statistics:
▶️ https://l10n.kde.org/stats/gui/stable-kf5/package/labplot/
Please get involved!
▶️ https://community.kde.org/Get_Involved/translation
4
1
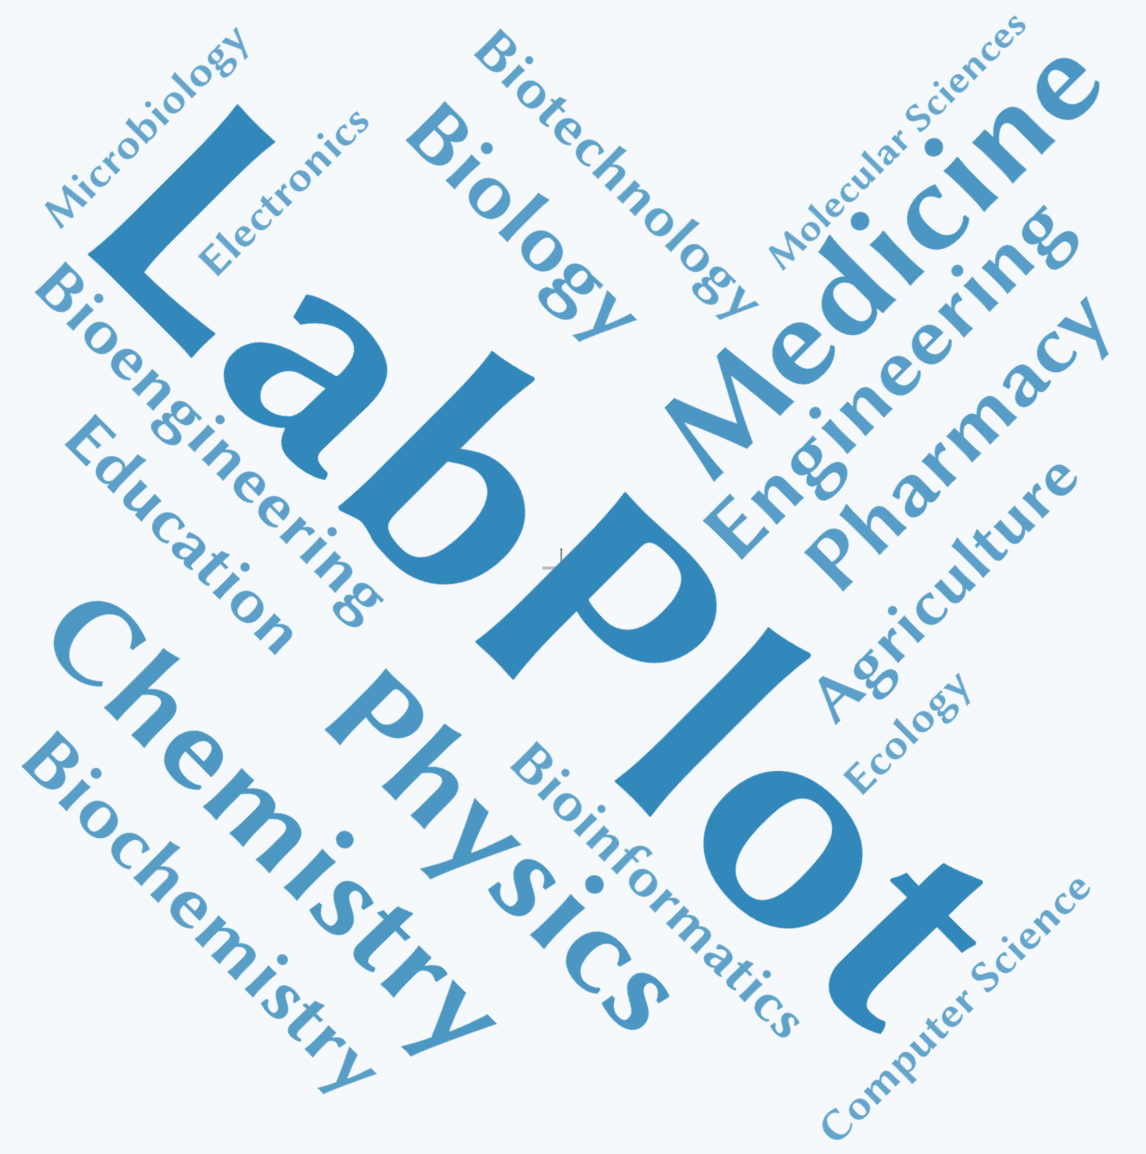
This page contains a list of external resources mentioning #LabPlot and its usage in various areas 👨🔬 🔭 🔬 .
(cdn.masto.host)
This page contains a list of external resources mentioning #LabPlot and its usage in various areas 👨🔬 🔭 🔬 .
➡️ https://labplot.kde.org/references/
If you are aware of other resources that could be listed there, please contact us.
#LabPlot #Science #Research #Students #Physics #Medicine #Chemistry #Biology #Engineering #Ecology #Electronics #Robotics #Education #OpenSource #FreeSoftware
5
6
1
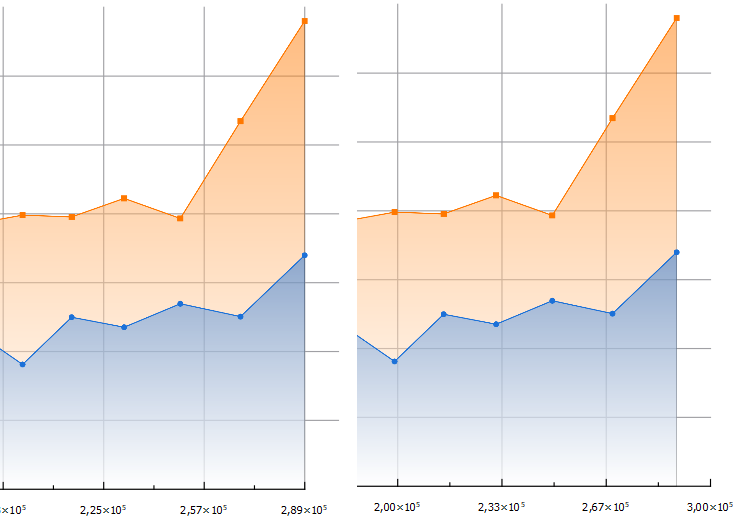
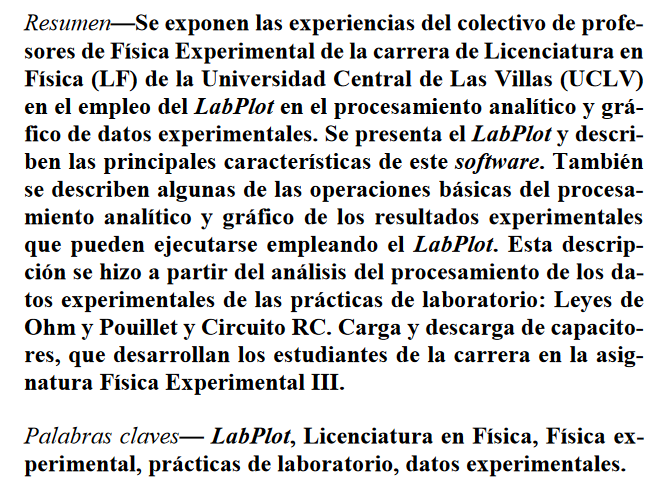
An open access article by W. Morales González and J. E. Hernández-Ruiz: Experiencias en el uso del software LabPlot en el procesamiento analítico y gráfico de datos experimentales
#LabPlot #Students #Research #DataAnalysis #Physics #DataVisualization #experimental #Física #Teaching #Chemistry #OpenSource #FreeSoftware
7
8
9
10
11
12
13
14
15
Labplot gets funding from NLnet to work on:
➡️ Live Data Analysis,
➡️ Python Scripting
➡️ Statistical Analysis
https://labplot.kde.org/2024/07/30/labplot-funded-through-ngio-core-fund/
#dataanalysis #funding #statistics #data #ngi #Python #opensource #foss #freesoftware #labplot #research #engineering #nlnet
16
17
18
19
20
The latest release of #LabPlot is here! 🚀 🙂
LabPlot 2.11 comes with many new features and improvements in various areas.
Go get it!
➡️ https://labplot.kde.org/download/
Read more about the release here:
➡️ https://labplot.kde.org/2024/07/16/labplot-2-11-released/
#DataAnalysis #DataScience #Analytics #Data #DataAnalytics #DataViz #DataVisualization #Science #Statistics #Mathematics #FOSS #FLOSS #OpenSource #KDE #Education #Business #SciDAViS
21
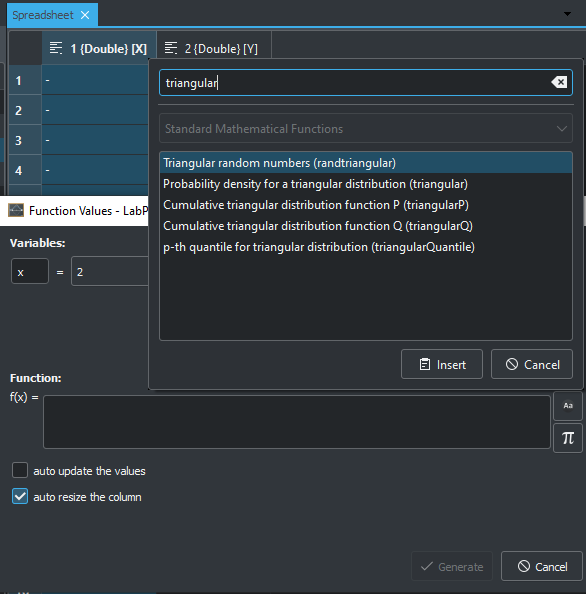
Easy work with a #TriangularDistribution is now possible in #LabPlot [dev].
Here are some of the most common applications of the triangular distribution:
▶️ Business and economic simulations
▶️ Risk analysis
▶️ Natural phenomena modeling
▶️ Decision-making
▶️ Manufacturing and quality control
#Business #Risk #DataAnalysis #Simulation #DataAnalysis #DataScience #Statistics #FOSS #OpenSource #Analytics #Projects #Math #Education
22
23
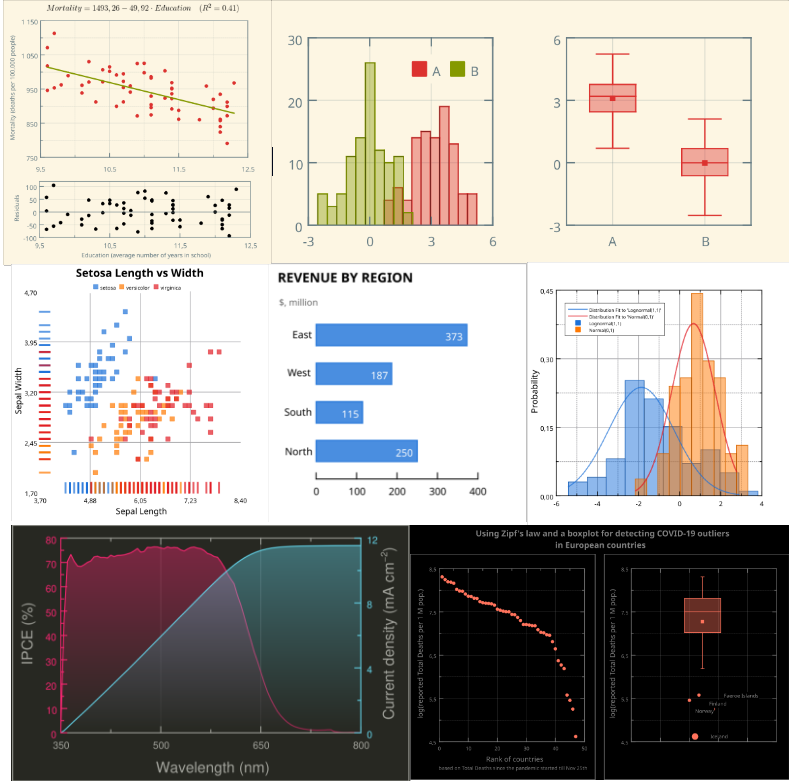
Below is just a small sample of plots that were created with #lLabPlot.
#LabPlot is a FREE, open source and cross-platform Data Visualization and Data Analysis software.
Would you like to share with us your plots made in LabPlot?
#DataAnalysis #DataScience #Analytics #Data #DataAnalytics #DataViz #DataVisualization #Science #Statistics #Mathematics #Math #STEM #FOSS #FLOSS #OpenSource #KDE #Education #Business
24
25
view more: next ›