this post was submitted on 12 Nov 2024
129 points (99.2% liked)

Selfhosted

40220 readers
1227 users here now

A place to share alternatives to popular online services that can be self-hosted without giving up privacy or locking you into a service you don't control.

Rules:

  1. Be civil: we're here to support and learn from one another. Insults won't be tolerated. Flame wars are frowned upon.

  2. No spam posting.

  3. Posts have to be centered around self-hosting. There are other communities for discussing hardware or home computing. If it's not obvious why your post topic revolves around selfhosting, please include details to make it clear.

  4. Don't duplicate the full text of your blog or github here. Just post the link for folks to click.

  5. Submission headline should match the article title (don’t cherry-pick information from the title to fit your agenda).

  6. No trolling.

Resources:

Any issues on the community? Report it using the report flag.

Questions? DM the mods!

founded 1 year ago
MODERATORS
 

Hi everyone, I've been building my own log search server because I wasn't satisfied with any of the alternatives out there and wanted a project to learn rust with. It still needs a ton of work but wanted to share what I've built so far.

The repo is up here: https://codeberg.org/Kryesh/crystalline

and i've started putting together some documentation here: https://kryesh.codeberg.page/crystalline/

There's a lot of features I plan to add to it but I'm curious to hear what people think and if there's anything you'd like to see out of a project like this.

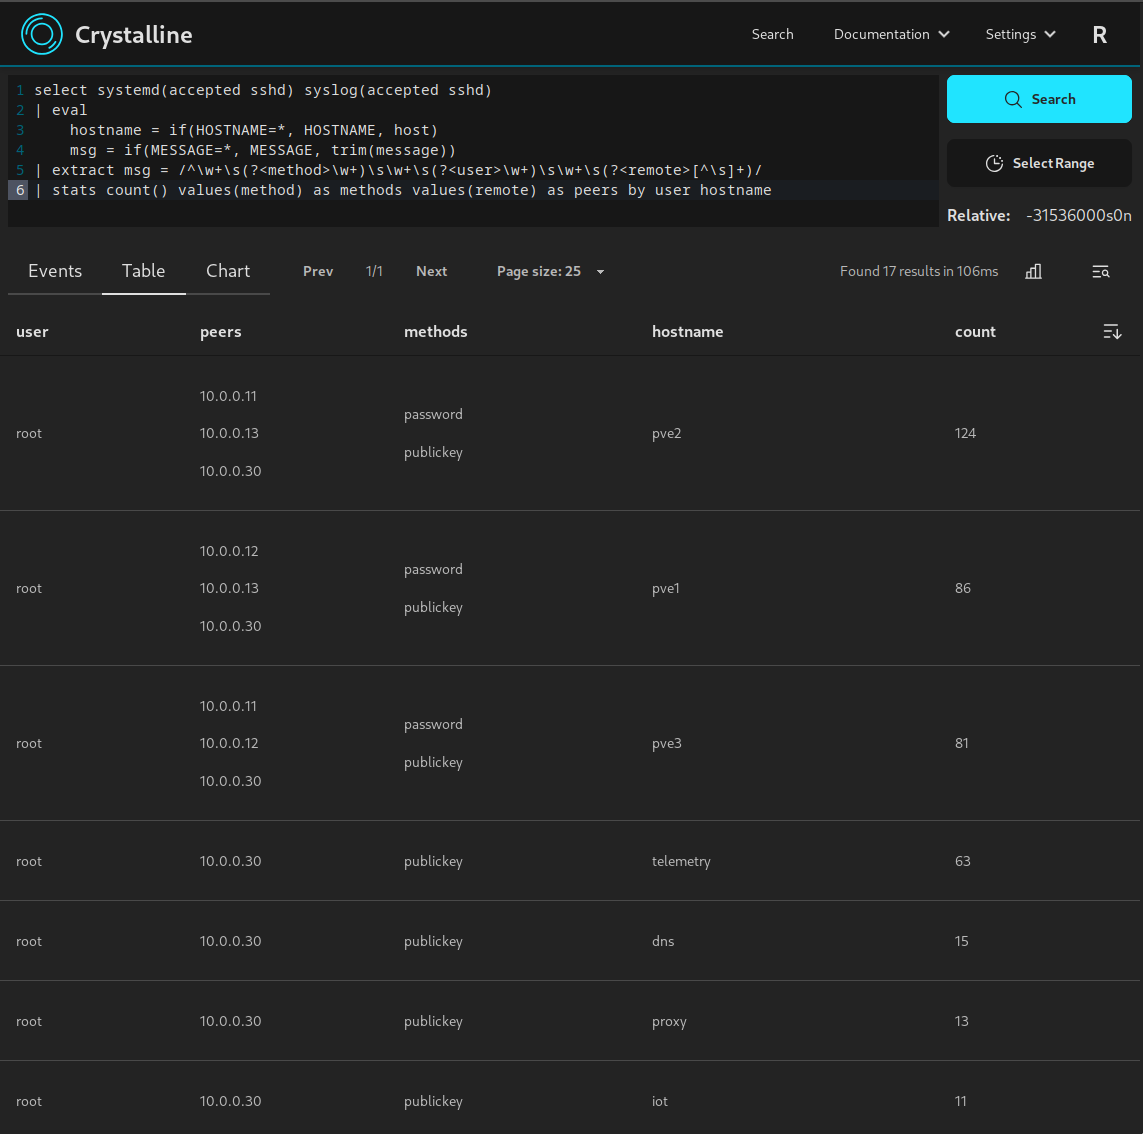
Some examples from my lab environment:

events view searching for SSH logins from systemd journals and syslog events:

counting raw event size for all indices:

performance is looking pretty decent so far, and it can be configured to not be too much of a resource hog depending on use case, some numbers from my test install:

  • raw events ingested: ~52 million
  • raw event size: ~40GB
  • on disk size: ~5.8GB

Ram usage:

  • not running searches ingesting 600MB-1GB per day it uses about 500MB of ram
  • running the ssh search examples above brings it to about 600MB of ram while the search is running
  • running last example search getting the size of all events (requires decompressing the entire event store) peaked at about 3.5GB of ram usage
top 19 comments
sorted by: hot top controversial new old
[–] [email protected] 24 points 6 days ago (1 children)

This looks nice, but there's plenty free alternatives in this space which warrants a section in the readme with the comparison to other products.

You mention ram usage, but it’s oftentimes a product of event size. Based on your numbers, your average event size is about 800 bytes. Let’s call it 1kb. That’s one million events per day. It’s surely sounds more promising than Elastic, but not reaching Loki numbers, or, if you focus on efficiency, is way behind Victoriametrics Logs (based on peeking at their benches).

I think the important bits you need to add is how you store the logs (i.e. which indices you build) and what are your trade-offs. Grep is an efficient logs processor which barely uses any ram but incurs dramatic I/O costs, after all.

Enterprises will be looking at different numbers and they have lots of SaaS products to choose from. Homelab users are absolutely your target audience and you can have it by making a better UI than the alternative (victoriametrics logs aren’t that comfortable to work with) or making resource usage lower (people run k8s clusters on RPis, they sure wonder about every megabyte of ram lost) or making the deployment easier (fire and forget, and when you come to it, it works).

It sounds like lots of things and I don’t want to be discouraging. What you started there is really nice-looking. Good job!

[–] [email protected] 10 points 6 days ago (1 children)

Thanks! it's definitely got a way to go before it's remotely competitive with any of the enterprise solutions out there, but you make a good point about having comparisons so I'll look at adding it.

I'm basically building it to have a KQL/LogScale/Splunk/Sumologic style search experience while being trivial to deploy (relative to others at least...) since I miss having that kind of search tooling when not at work; but I don't want to pay for or maintain that kind of thing in a lab context. It creates a Tantivy index per day for log storage (with scoring and postings disabled for space savings).

In the end my main goal of the project was as a vehicle to get better at programming with, and if I get a tool I can use for my lab then that's great too lol.

[–] [email protected] 6 points 6 days ago (1 children)

You’re nailing your goal then!

I would still steer you slightly towards documenting your architectural decisions more. It's a good skill to have and will help you in a long run.

You have dozens of crate dependencies and only you know why they are in there. A high-level document on how your system interconnects and how the algorithms under the hood work will be a huge help to anyone who comes looking through your source code. We become better programmers not by reading the source code, but by understanding what it actually does.

Here's a random trivia: your server depends on trust-dns-resolver. Why? Why wasn’t the stock resolver enough? Is that a design choice or you just wanted to have fun? There is no wrong answer but without the design notes it's hard to figure your intent.

[–] [email protected] 3 points 6 days ago (1 children)

More good points, thank you! for trust-dns-resolver that's a relic from a previous iteration that had polling external sources and needed to resolve dns records. Since i haven't gotten around to re-implementing that feature it should be removed. As for why - I actually needed to bring my own resolver since the docker container is a scratch image containing only some base directories and the server binary so there isn't any OS etc to lean on for things like dns; means that the whole image is ~15.5MB which is nice and negates a whole class of vulnerabilities.

Understood that your actual point is to document this stuff and not answer the trivia question though

[–] [email protected] 2 points 6 days ago (1 children)

That's a good point. Mind that in most production environments you'd be firewalled rather hard (especailly when it comes to logs processing which oftentimes ends up having PII). I wouldn’t trust any service that tries to use DoT or DoH in there that I couldn’t snoop on. Many deployments nowadays allow you to "punch" firewall holes based on the outgoing dns requests to an allowlisted domain, so chances are you actually want to use the glibc resolver and not try to be fancy.

That said, smaller images are always good in my book!

[–] [email protected] 2 points 5 days ago* (last edited 5 days ago)

Oh I wasn't using it as a full recursive resolver - just reading the resolv.conf set by docker and sending requests

[–] [email protected] 8 points 6 days ago (1 children)

That looks great, congrats!

If you're targeting us, homelabbers, I'll tell you what I would want from a log server:

  • Stupid easy installation (Docker / Proxmox)
  • Integrations with:
  • Proxmox
  • Docker
  • Home Assistant
  • Frigate
  • Scrypted
  • Jellyfin
  • Immich
  • Unifi
[–] [email protected] 0 points 5 days ago (1 children)

Thanks! definitely aiming for a stupid easy installation/management for the app itself; but in my experience getting a wide range of supported log sources is no small feat. I've been using fluentbit to handle collection from different sources and using the following has been working well for me:

  • docker 'journald' log driver
  • fluentbit 'systemd' input
  • fluentbit 'http' output like the one in the readme

with that setup you can search for container logs by name which works great with compose:

or process logs from an nginx container like this to see traffic from external hosts:

I'll add a more complete example to the docs, but if you look in the repo there's a complete example for receiving and ingesting syslog that you can run with just "docker compose up"

[–] [email protected] 1 points 5 days ago (1 children)

Maybe you should add OTLP support? I don't know how you are ingesting from Fluentbit at the moment, but I think with OTLP basically any log source can be integrated either through the fluentbit OTLP plugin or an OTEL collector.

[–] [email protected] 1 points 4 days ago

I'm currently using the fluentbit http output plugin, fluentbit can act as an otel collector with an input plugin which could then be routed to the http output plugin. Long term I'll probably look at adding it but there's other features that take priority in the app itself such as scheduled searching and notifications/alerting

[–] [email protected] 3 points 6 days ago

Kudos on the project! I often thought about building something similar myself, because I wasn’t happy with what’s out there. Everything is so complicated to set up and way too oversized for a simple log collection service, or the UI is just bad and super unintuitive for no reason. Glad you’re brining some new wind into the space.

[–] [email protected] 1 points 5 days ago (1 children)

I don't really understand the point of this. What kind of logs are you storing and why would you want to?

[–] [email protected] 1 points 5 days ago (1 children)
[–] [email protected] 1 points 4 days ago (2 children)

Why do logs help with threat detection?

[–] [email protected] 2 points 4 days ago* (last edited 4 days ago) (1 children)

Applications like metrics because they're good for doing statistics so you can figure out things like "is this endpoint slow" or "how much traffic is there"

Security teams like logs because they answer questions like "who logged in to this host between these times?" Or "when did we receive a weird looking http request", basically any time you want to find specific details about a single event logs are typically better; and threat hunting does a lot of analysis on specific one time events.

Logs are also helpful when troubleshooting, metrics can tell you there's a problem but in my experience you'll often need logs to actually find out what the problem is so you can fix it.

[–] [email protected] 1 points 4 days ago

Yeah that makes sense now. Thanks for the explanation.

[–] [email protected] 1 points 4 days ago

When you start seeing a lot of failed login attempts or other suspicious activity you know you are in trouble

[–] [email protected] 1 points 5 days ago

This is very cool.

I an slowly building my own syslog server with visualization, but it's cool to see new stuff on the block.

I have always been wary of big commercial services like kibana, grafana, etc...