this post was submitted on 16 Jun 2024
264 points (92.9% liked)
Data Is Beautiful
6855 readers
1 users here now
A place to share and discuss data visualizations. #dataviz
(under new moderation as of 2024-01, please let me know if there are any changes you want to see!)
founded 3 years ago
MODERATORS
you are viewing a single comment's thread
view the rest of the comments
view the rest of the comments

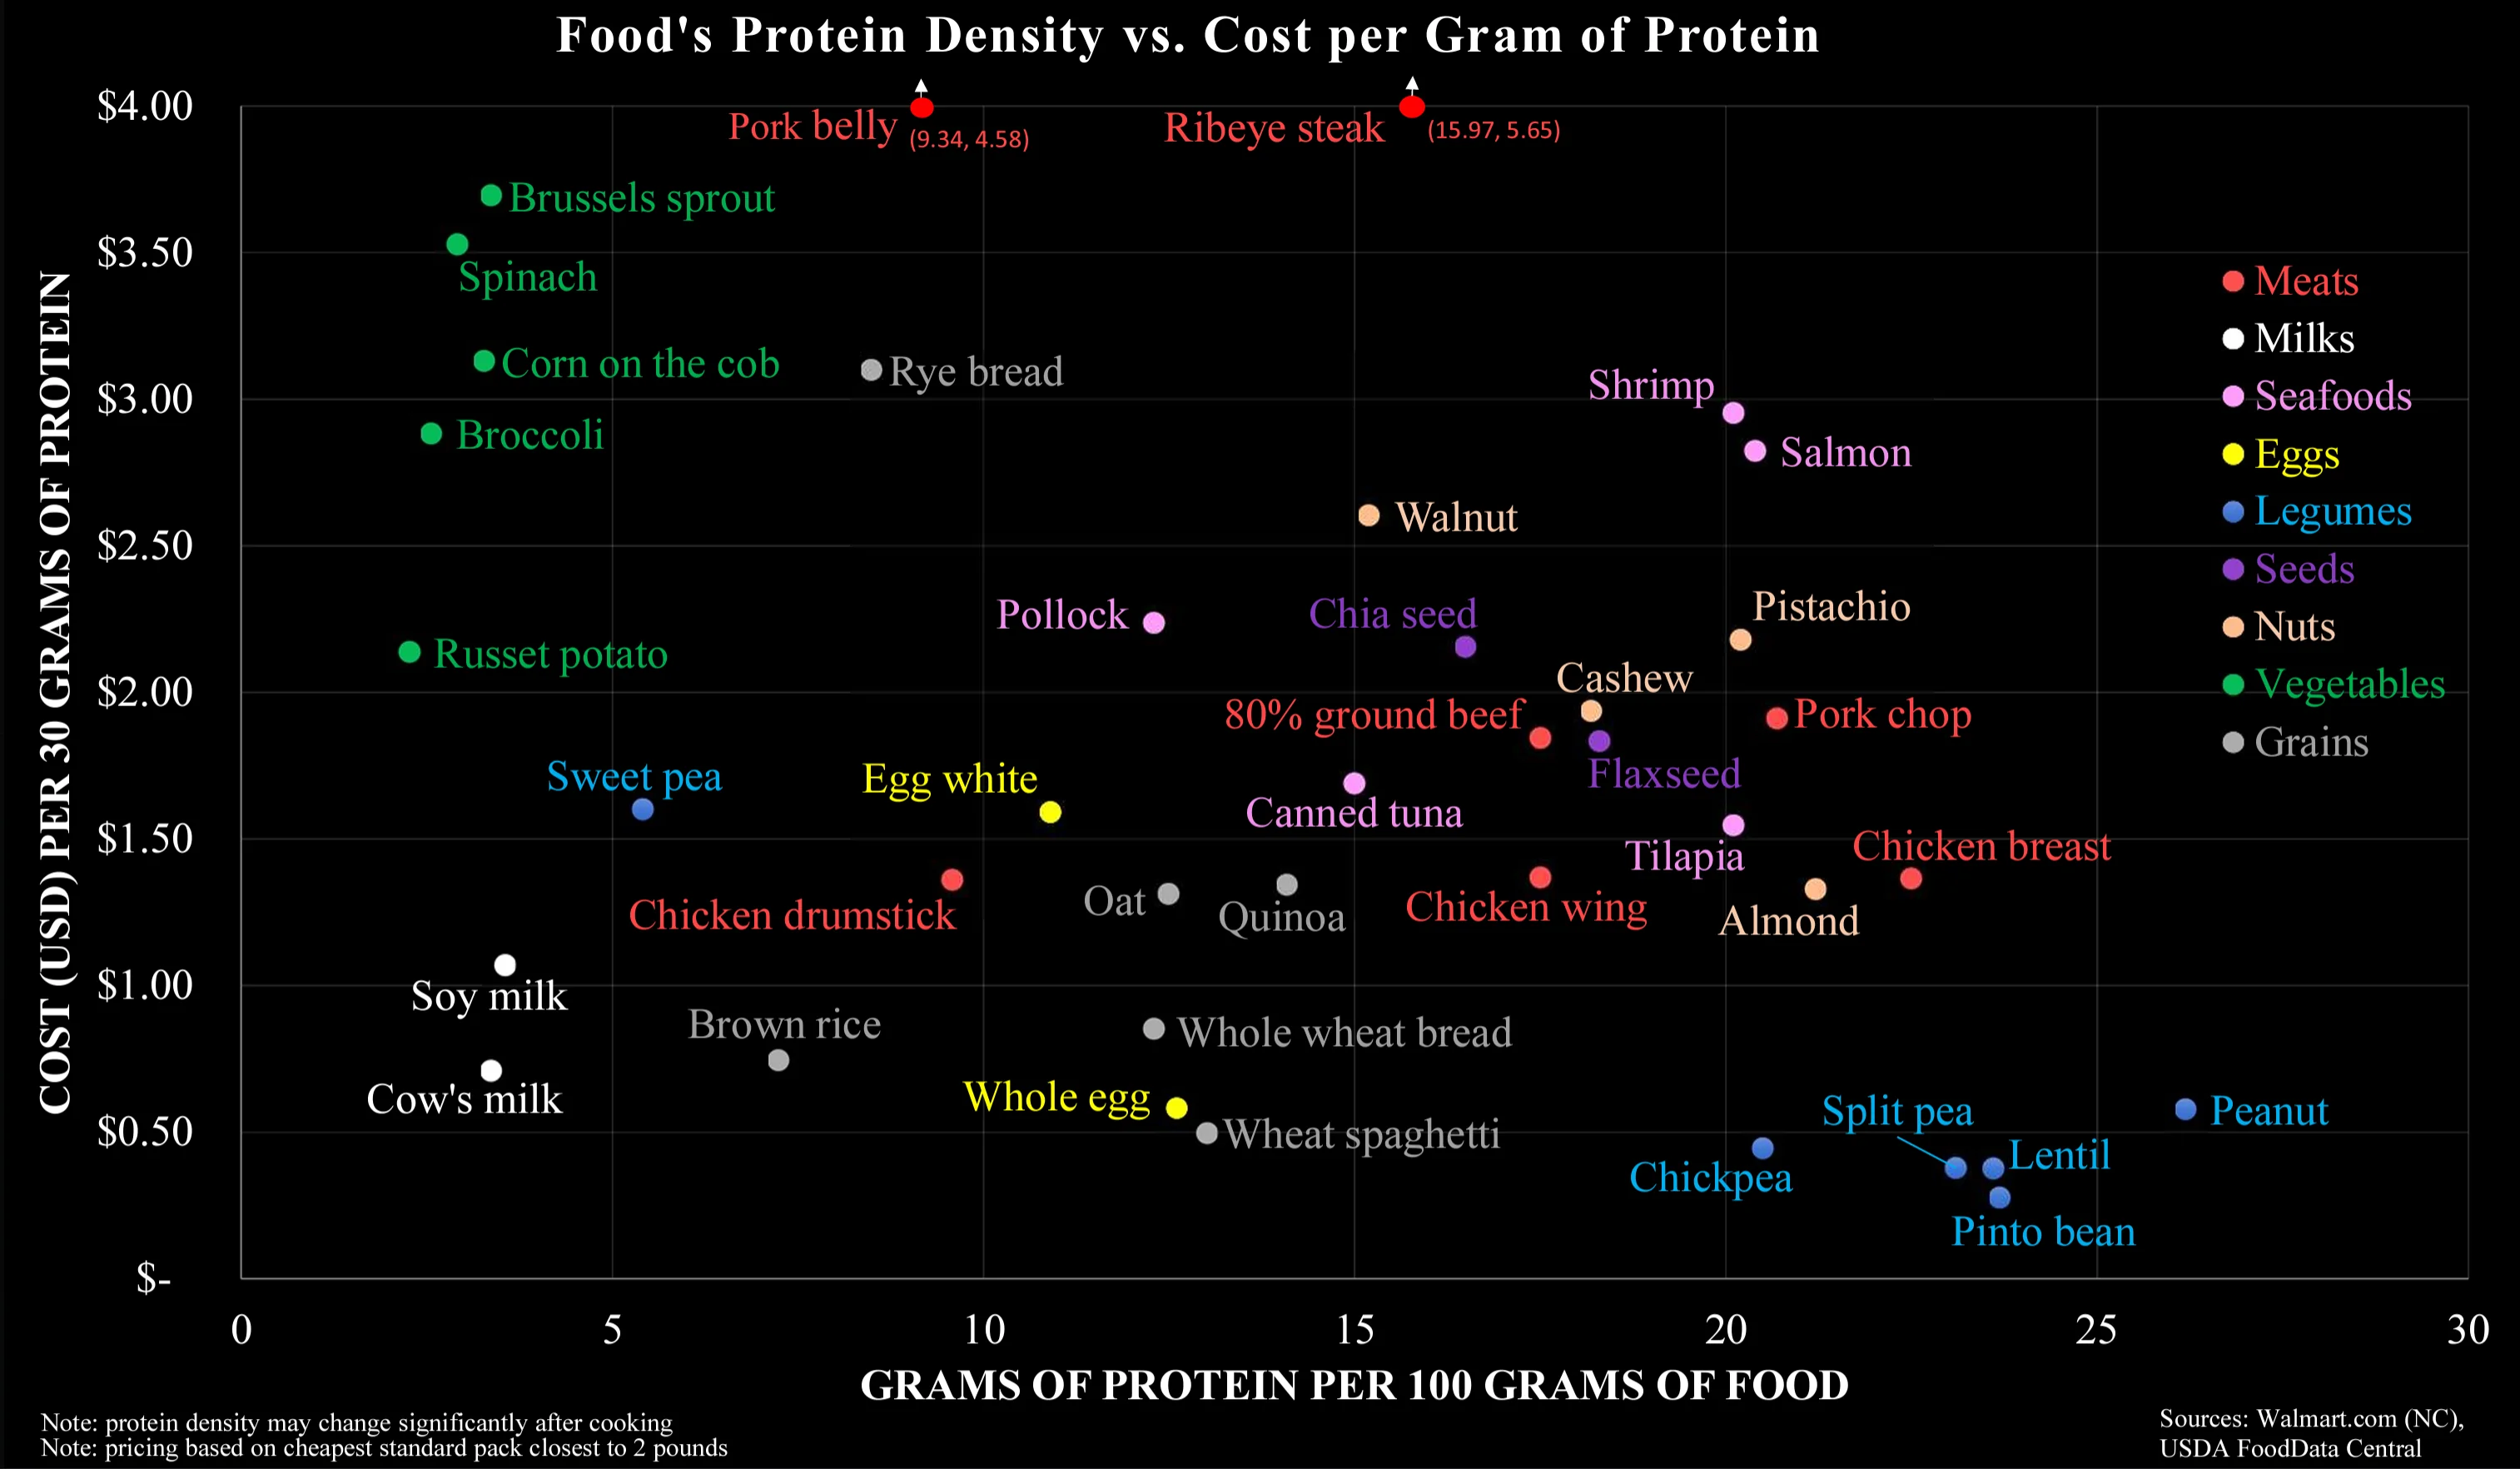
Monetary cost is the wrong y-axis here, as it optimizes only for mega-scale farming without taking its real costs in consideration. It should be ‘true cost’, which also accounts for environmental-, animal- and climate mitigation cost.
I think this is what it's meant to be about. "How do I afford a good amount of protein with not much money?", is the question it's answering.
It reminds me of a Reddit post I read several years ago where someone shared their advice on how they managed to live under extreme poverty. They spent a good amount of time talking about what foods are the most cost effective to buy and this chart lines up with what they have been saying pretty well.